Quantitative Trading Strategy Based on SMA and EMA

I. Strategy Overview
This strategy is named "Quantitative Trading Strategy Based on SMA and EMA". Its main idea is to combine SMA lines and EMA lines with different parameters to construct trading signals.
II. Strategy Principle
-
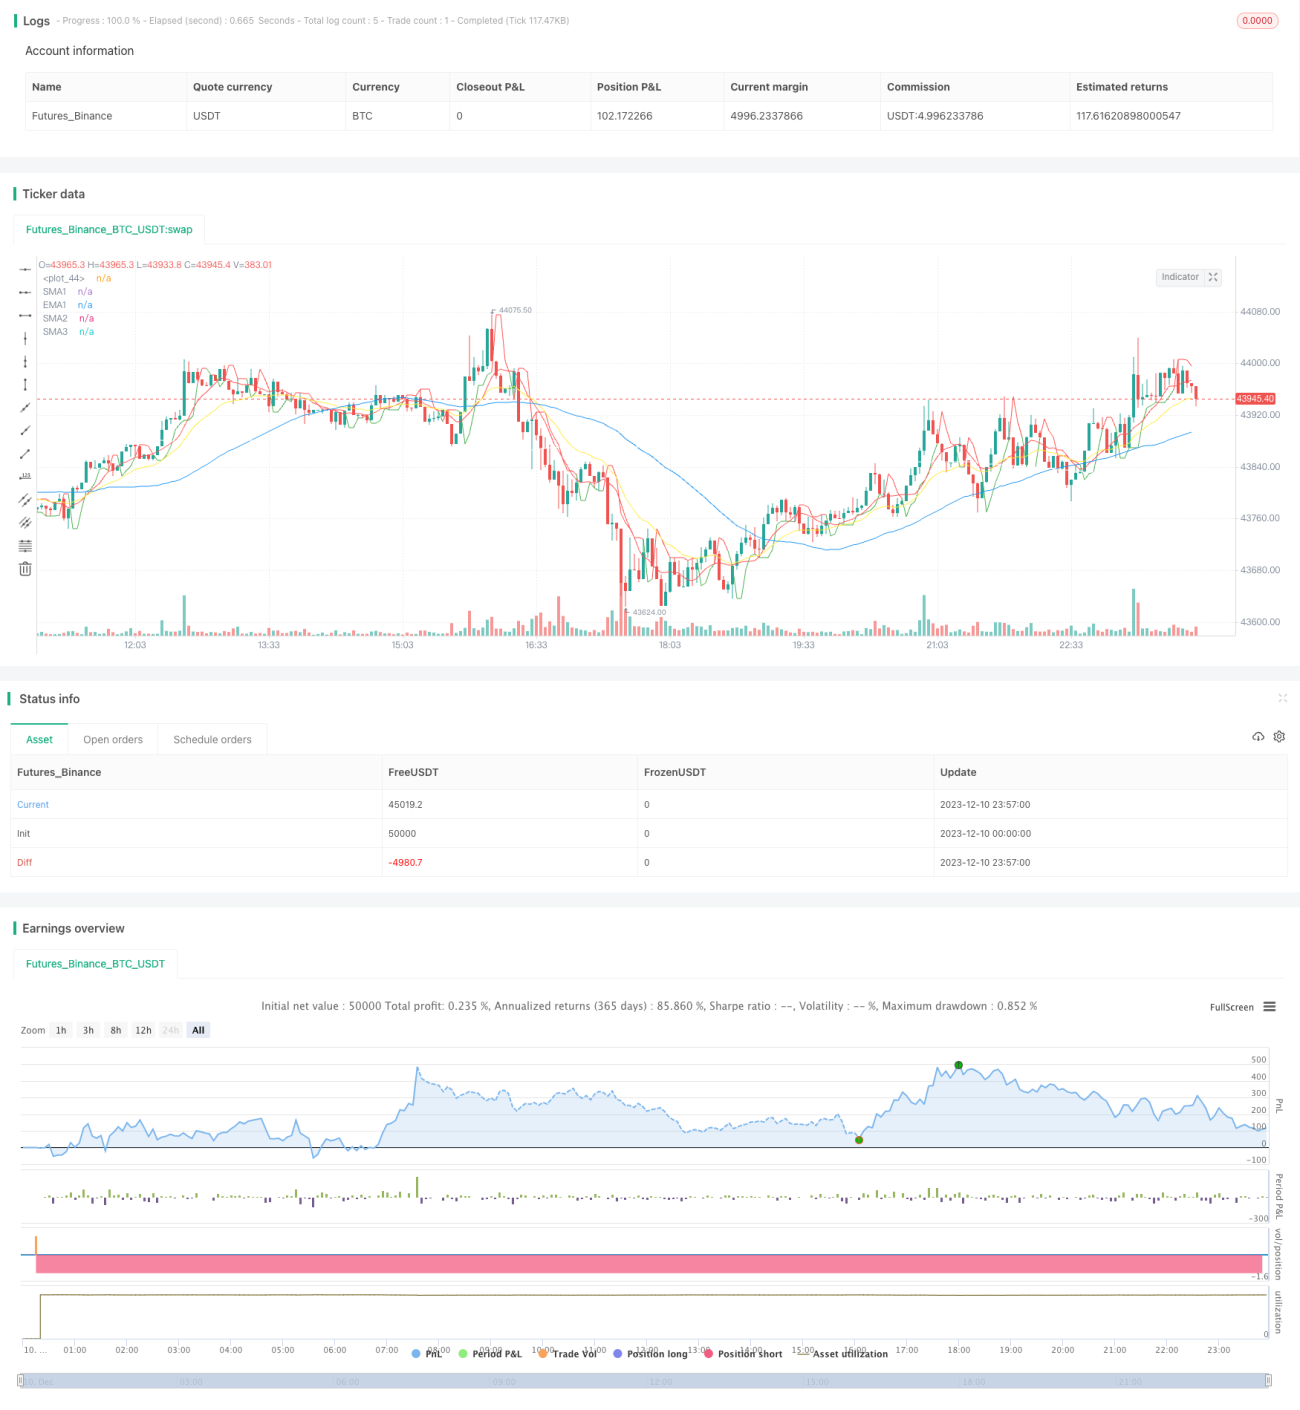
Calculate the SMA9, SMA50, SMA180 of close price and EMA20.
-
Determine buy and sell signals based on the relationship between close price and support sup and resistance res. Generate buy signal BuySignal when close breaks through sup, and generate sell signal SellSignal when close breaks through res.
-
When buy signal triggers, execute long position strategy; when sell signal triggers, close long position.
-
When sell signal triggers, execute short position strategy; when buy signal triggers, close short position.
III. Advantage Analysis
-
Combining multiple moving averages to form trading signals improves accuracy and stability.
-
Calculating dynamic support and resistance makes trading signals more reliable.
-
Adopting high, medium and low volatility moving averages considers both long-term trend and short-term breakthroughs, improving the strategy's profitability.
-
Supporting both long and short positions can obtain profits in trending and sideways markets.
IV. Risk Analysis
-
SMA has lagging effect, which may delay buy and sell signals and affect strategy performance.
-
No stop loss mechanism, losses may expand.
-
Insufficient backtesting data, parameters need to be adjusted according to the market.
-
Relying on technical indicators, unable to cope with black swan events.
Solutions:
- Adjust SMA periods properly.
- Set reasonable stop loss.
- Increase sample size for backtesting, adjust parameters.
- Improve risk control mechanisms.
V. Optimization
-
Add volatility based stop loss to control single loss.
-
Add machine learning models to assist with trend judgment and signal generation.
-
Add key price analysis to improve support and resistance accuracy.
-
Test different parameter combinations to find better parameters.
VI. Summary
This strategy combines the technical indicators of SMA and EMA to construct trading signals, and calculates dynamic support and resistance to form a complete buy and sell logic. The advantages are flexible parameters, two-way trading, adaptable to different markets, but it also faces issues like lagging and inadequate stop loss. Future optimizations can be made in aspects like stop loss, trend judgment, key price analysis to improve stability and profitability.
]
/*backtest
start: 2023-12-10 00:00:00
end: 2023-12-11 00:00:00
period: 3m
basePeriod: 1m
exchanges: [{"eid":"Futures_Binance","currency":"BTC_USDT"}]
*/

//@version=4
strategy(title="StrategySMA 9/50/180 | EMA 20 | BUY/SELL", overlay=true, initial_capital=10000, default_qty_type=strategy.percent_of_equity, default_qty_value=100)

//SMA and EMA code- 1