Trend Trading Strategy Based on Price Extremum

Overview
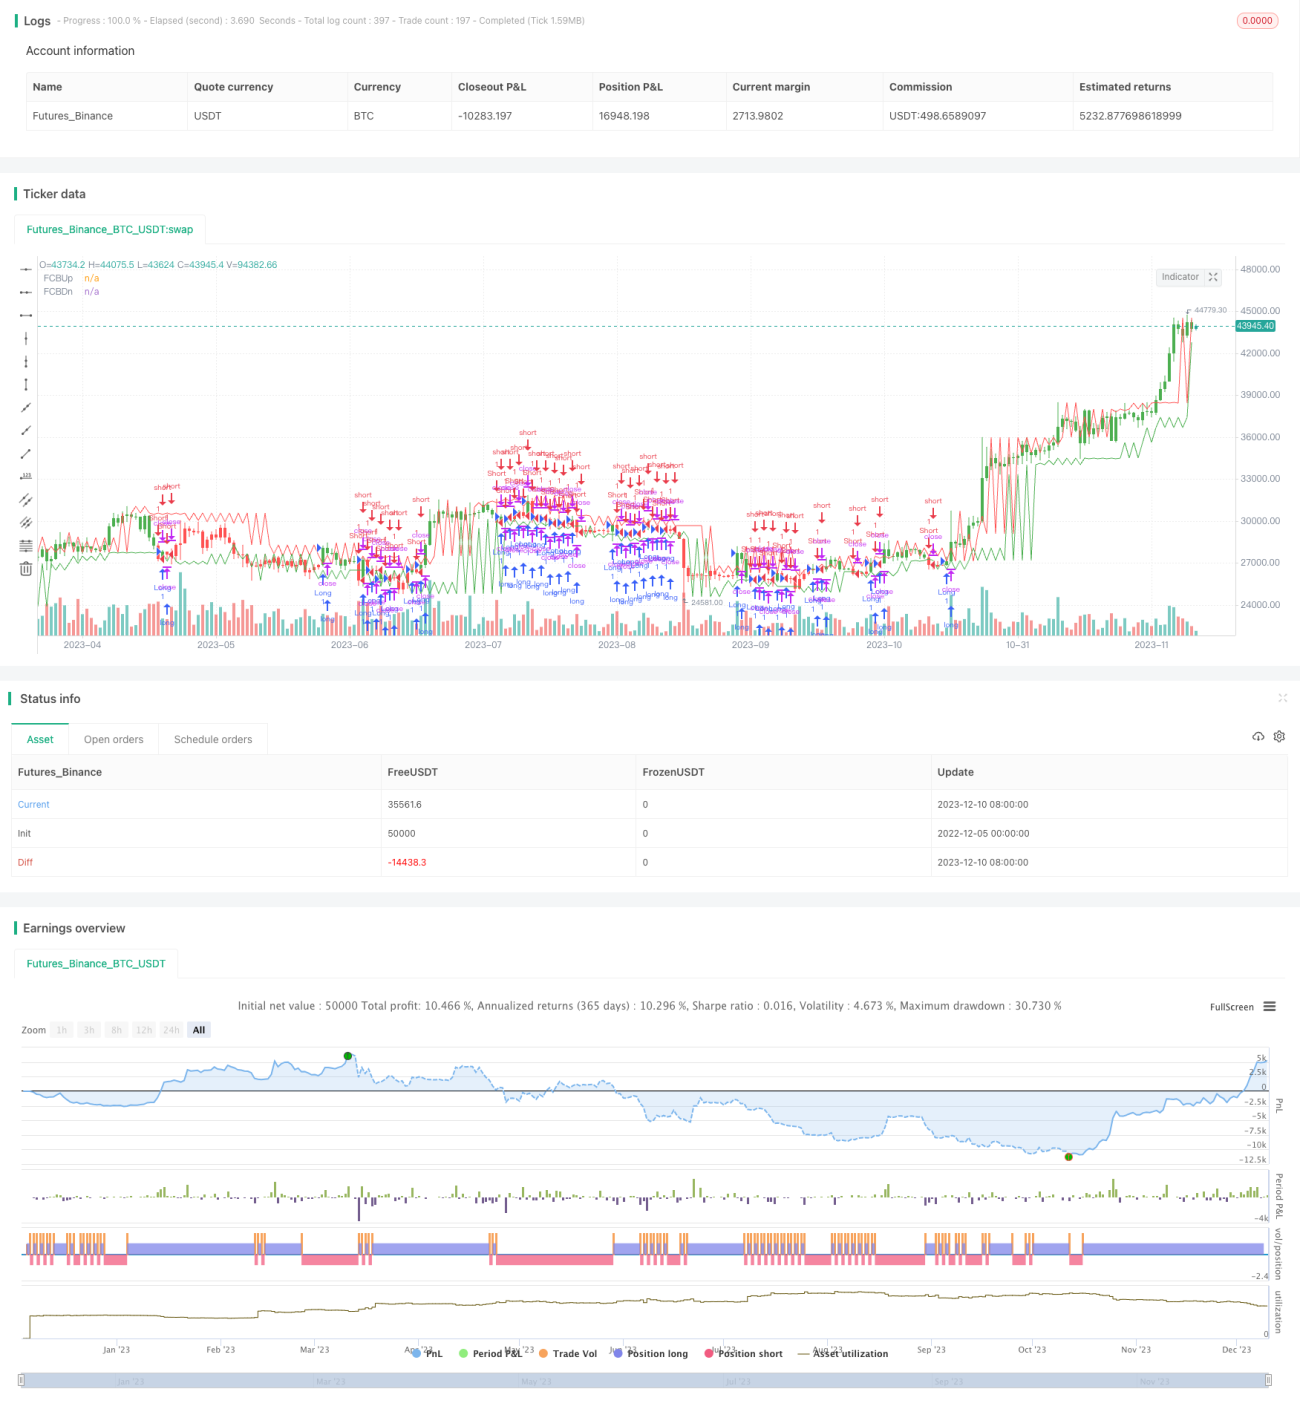
This strategy calculates the maximum and minimum price points over a certain period to form upper and lower bands. When the current price breaks through the upper or lower band, long or short positions are taken. The strategy mainly judges the trend of prices and trades when the trend strengthens.
Strategy Logic
The core indicator of this strategy is to calculate the maximum and minimum price points over a period. The specific calculation methods are:
Upper Band: Scan the K-line in the period from left to right to find a maximum high point, and then determine whether the 1st K-line on its left to the utmost left and the 1st K-line on its right to the utmost right are both lower than this maximum high point. If so, this point is confirmed as the top of the range.
Lower Band: Scan the K-line in the period from left to right to find a minimum low point, and then determine whether the 1st K-line on its left to the utmost left and the 1st K-line on its right to the utmost right are both higher than this minimum low point. If so, this point is confirmed as the bottom of the range.
By repeating this calculation, the upper and lower bands of prices over a period can be obtained. Take long positions when prices break through the upper band and take short positions when prices break through the lower band. This forms a trend trading strategy based on determining trend by price extremum points.
Advantage Analysis
The way this strategy judges the trend is quite straightforward by determining the strengthening part of the trend through price extremum points, which can effectively filter out consolidation scenarios and avoid trading in consolidations. The signal generation position of the strategy has advantages and can easily form trend tracking. In addition, the strategy takes signals in a relatively strict way, which can reduce erroneous signals.
Risk Analysis
The strategy takes signals quite strictly, which may miss more trading opportunities. In addition, extremum points need some time to accumulate and form, which will be relatively lagging. The parameters need proper optimization. When the parameters are improper, erroneous signals are also very likely to occur.
The strictness of judging the extremum points can be moderately reduced to allow some fluctuations to reduce the risk of misjudgment. In addition, confirmation can be made with other indicators to avoid wrong signals.
Optimization Directions
The cycle for determining the upper and lower bands can be properly optimized to better capture the trend. In addition, the scanning range for judging extremum points can also be adjusted.
To reduce the possibility of missing trading opportunities, the conditions for determining extremum points can be moderately loosened to allow some fluctuation.
Attempts can be made to confirm with other indicators such as volume indicators, moving averages, etc. to avoid the risk of wrong signals resulting from single indicator judgment.
Conclusion
The way this strategy judges trend characteristics by price extremum points is quite straightforward and effective. It can effectively filter out consolidation and determine the strengthening time of trends for trend trading. The advantage of the strategy lies in good signal generation position to chase trends. The shortcoming is that the signals may have some lag and it is difficult to capture turns. Through the optimization of parameters and conditions, this strategy can become a relatively reliable trend judging tool.
/*backtest
start: 2022-12-05 00:00:00
end: 2023-12-11 00:00:00
period: 1d
basePeriod: 1h
exchanges: [{"eid":"Futures_Binance","currency":"BTC_USDT"}]
*/

//@version=2
////////////////////////////////////////////////////////////
//  Copyright by HPotter v1.0 19/02/2018
// Stock market moves in a highly chaotic way, but at a larger scale, the movements - 1