概述
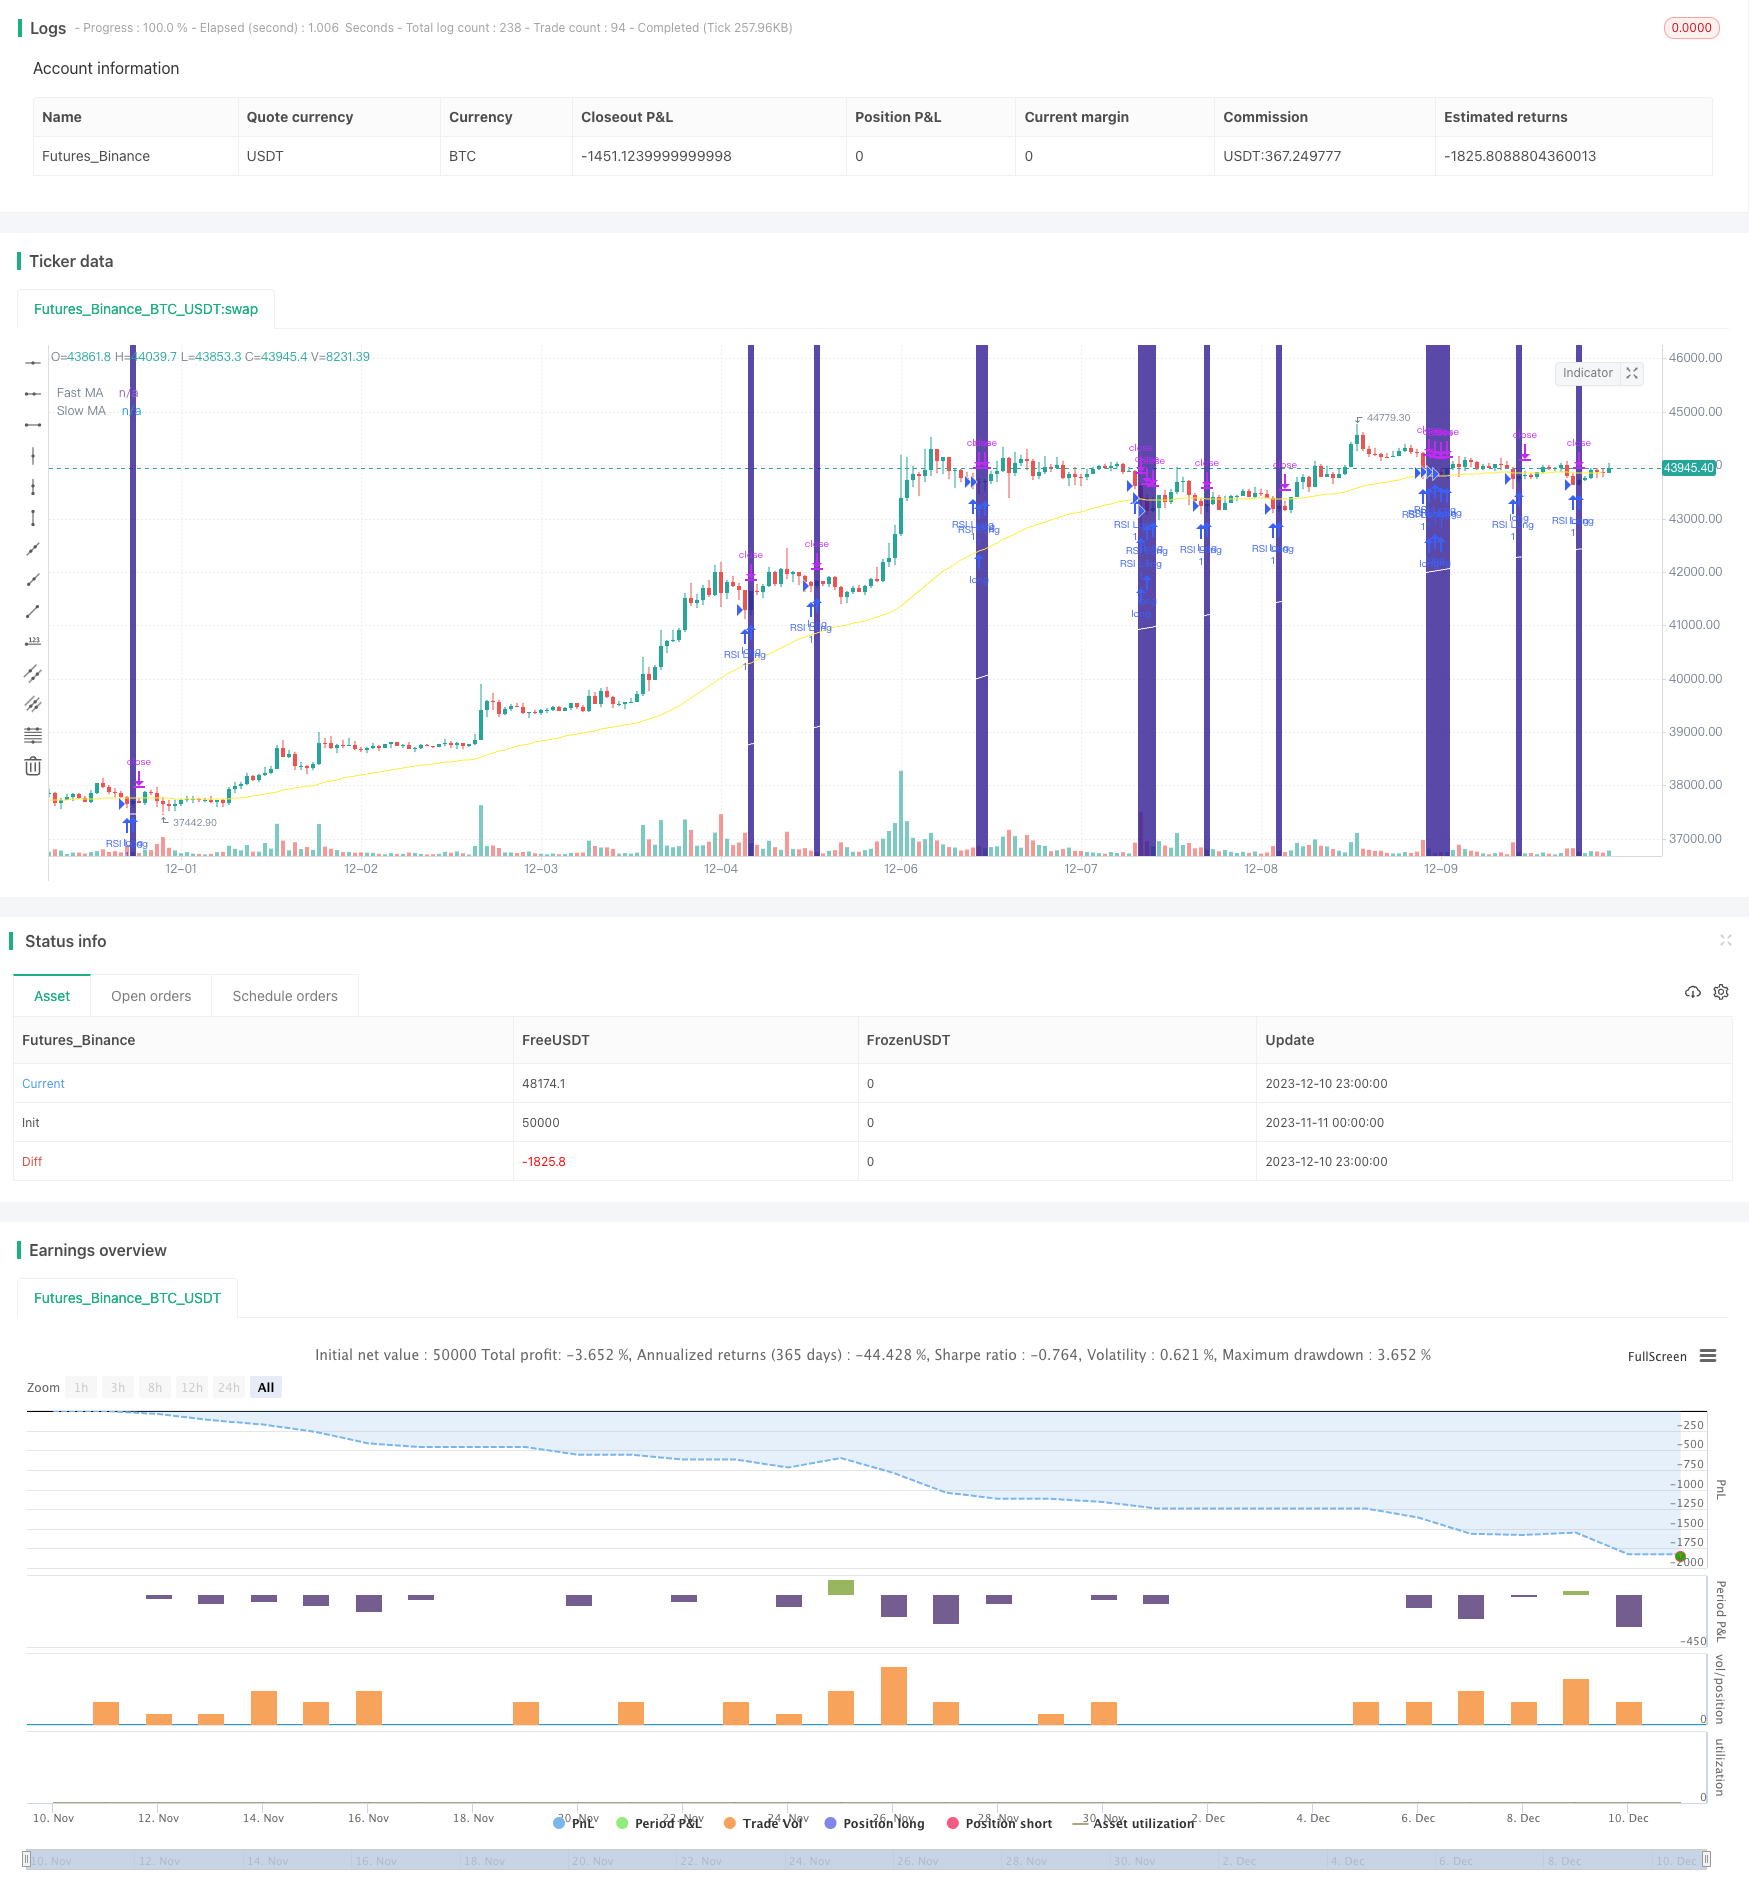
本策略名称为“基于RSI指标的趋势跟踪止损策略”。该策略利用RSI指标判断超买超卖情况,结合快慢MA指标判断趋势方向,设定入场条件。同时使用百分比跟踪止损机制,实现止损退出。
策略原理
该策略主要通过RSI指标和MA指标判断入场时机。RSI指标参数设置为2周期,判断超买超卖情况。快慢MA分别设置为50周期和200周期,判断趋势方向。具体入场逻辑为:
多头入场:快MA上穿慢MA,且价格高于慢MA,同时RSI低于超卖区域(默认10%)时做多;
空头入场:快MA下穿慢MA,且价格低于慢MA,同时RSI高于超买区域(默认90%)时做空。
此外,策略还设定了一个可选的波动率过滤器。该过滤器计算快慢MA的斜率差值,当差值超过设定阈值时才会开仓。其目的是避免价格震荡期无明确方向时开仓。
exit上,策略采用百分比跟踪止损方式。根据输入的止损百分比,结合每跳价差计算出止损价位,实现动态调整止损。
优势分析
该策略主要具有以下优势:
- RSI指标参数设置为2周期,能快速捕捉超买超卖情况,判断反转机会。
- 快慢MA能有效识别趋势方向和转折点。
- 结合RSI和MA双重指标判断,可避免假突破。
- 设置波动率过滤器,可过滤震荡市无明确方向时期。
- 采用百分比跟踪止损方式,可根据市场波动性调整止损幅度,有效控制风险。
风险分析
该策略也存在一定风险,主要体现在:
- RSI和MA指标存在一定滞后性,可能错过部分反转机会。
- 百分比止损在缩量下跌中容易被触发。
- 无法有效处理夜盘和盘前波动较大的品种。
针对上述风险,可从以下方面进行优化:
- 调整RSI参数,设置为1周期,可减少滞后性。
- 根据不同品种特点调整MA周期参数。
- 调整百分比止损水平,兼顾止损与震荡容忍度。
策略优化方向
该策略可从以下方面进行优化:
- 增加其他指标判断,如增加成交量指标,避免虚假突破。
- 增加机器学习模型判断,利用模型预测结果辅助决策。
- 优化复利次数和仓位管理,进一步提升策略收益率。
- 设定夜盘和盘前波动过滤机制。根据波动幅度设定是否参与下个交易日决策。
总结
本策略整体来说是一款较为稳定的趋势跟踪策略。它结合RSI和MA双重指标判断,在保证一定稳定性的同时,也能捕捉比较明确的趋势反转机会。同时设置波动率过滤器可避免部分风险,百分比止损方式也能有效控制单笔损失。该策略可作为多品种通用策略使用,也可针对特定品种进行参数调整和模型优化,从而获得更好的策略效果。
策略源码
/*backtest
start: 2023-11-11 00:00:00
end: 2023-12-11 00:00:00
period: 1h
basePeriod: 15m
exchanges: [{"eid":"Futures_Binance","currency":"BTC_USDT"}]
*/

// Scalping strategy
// © Lukescream and Ninorigo
// (original version by Lukescream - lastest versions by Ninorigo) - v1.3
//

//@version=4
strategy(title="Scalping using RSI 2 indicator", shorttitle="RSI 2 Strategy", overlay=true, pyramiding=0, process_orders_on_close=false)

var bool ConditionEntryL = false
var bool ConditionEntryS = false


//***********
// Costants
//***********
def_start_date = timestamp("01 Jan 2021 07:30 +0000")
def_end_date   = timestamp("01 Dec 2024 07:30 +0000")

def_rsi_length = 2
def_overbought_value = 90
def_oversold_value   = 10

def_slow_ma_length = 200
def_fast_ma_length = 50
def_ma_choice      = "EMA"

def_tick   = 0.5
def_filter = true

def_trailing_stop = 1


//***********
// Change the optional parameters
//***********
start_time  = input(title="Start date", defval=def_start_date, type=input.time)
end_time    = input(title="End date", defval=def_end_date, type=input.time)
// RSI
src         = input(title="Source", defval=close, type=input.source)
rsi_length  = input(title="RSI Length", defval=def_rsi_length, minval=1, type=input.integer)
overbought_threshold = input(title="Overbought threshold", defval=def_overbought_value, type=input.float)
oversold_threshold   = input(title="Oversold threshold", defval=def_oversold_value, type=input.float)
// Moving average
slow_ma_length = input(title="Slow MA length", defval=def_slow_ma_length, type=input.integer)
fast_ma_length = input(title="Fast MA length", defval=def_fast_ma_length, type=input.integer)
ma_choice = input(title="MA choice", defval="EMA", options=["SMA", "EMA"])
// Input ticker
tick   = input(title="Ticker size", defval=def_tick, type=input.float)
filter = input(title="Trend Filter", defval=def_filter, type=input.bool)
// Trailing stop (%)
ts_rate = input(title="Trailing Stop %", defval=def_trailing_stop, type=input.float)


//***********
// RSI
//***********
// Calculate RSI
up   = rma(max(change(src), 0), rsi_length)
down = rma(-min(change(src), 0), rsi_length)
rsi = (down == 0 ? 100 : (up == 0 ? 0 : 100-100/(1+up/down)))


//***********
// Moving averages
//***********
slow_ma = (ma_choice == "SMA" ? sma(close, slow_ma_length) : ema(close, slow_ma_length))
fast_ma = (ma_choice == "SMA" ? sma(close, fast_ma_length) : ema(close, fast_ma_length))
// Show the moving averages
plot(slow_ma, color=color.white,  title="Slow MA")
plot(fast_ma, color=color.yellow, title="Fast MA")


//***********
// Strategy
//***********
if true
    // Determine the entry conditions (only market entry and market exit conditions)
    // Long position
    ConditionEntryL := (filter == true ? (fast_ma > slow_ma and close > slow_ma and rsi < oversold_threshold) : (fast_ma > slow_ma and rsi < oversold_threshold))
    // Short position
    ConditionEntryS := (filter == true ? (fast_ma < slow_ma and close < slow_ma and rsi > overbought_threshold) : (fast_ma < slow_ma and rsi > overbought_threshold))

    // Calculate the trailing stop
    ts_calc = close * (1/tick) * ts_rate * 0.01

    // Submit the entry orders and the exit orders
    // Long position
    if ConditionEntryL
        strategy.entry("RSI Long", strategy.long)
    // Exit from a long position
    strategy.exit("Exit Long", "RSI Long", trail_points=0, trail_offset=ts_calc)

    // Short position
    if ConditionEntryS
        strategy.entry("RSI Short", strategy.short)
    // Exit from a short position
    strategy.exit("Exit Short", "RSI Short", trail_points=0, trail_offset=ts_calc)

// Highlights long conditions
bgcolor (ConditionEntryL ? color.navy : na, transp=60, offset=1, editable=true, title="Long position band")
// Highlights short conditions
bgcolor (ConditionEntryS ? color.olive : na, transp=60, offset=1, editable=true, title="Short position band")