EMA Tracking Trend Suppressing Oscillation Strategy

Overview
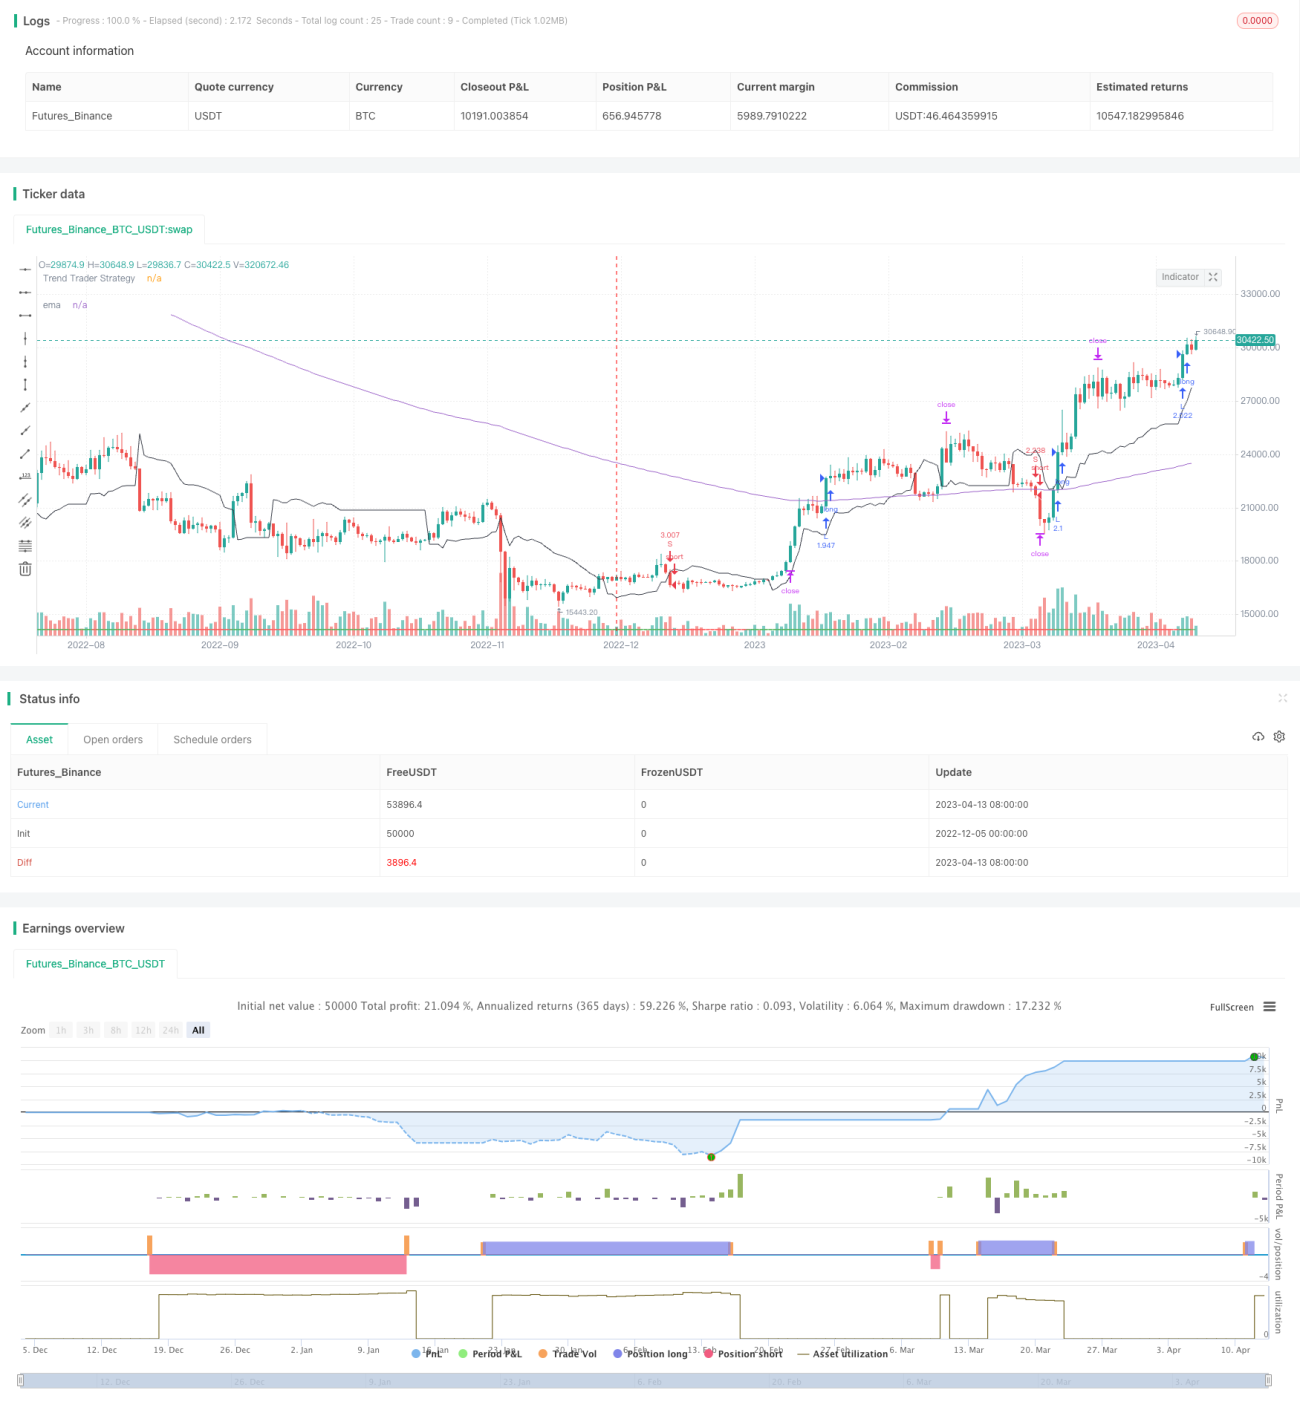
This strategy combines the advantages of three indicators: EMA, Trend Tracking Strategy (TTS) and Schaff Trend Cycle (STC) to form a strong short-term trend tracking strategy. Specifically, the strategy will judge whether the buy and sell signals of the three indicators are consistent. If they are consistent, trading signals will be generated; otherwise no trades will be made. This filters out some false signals and makes the strategy more reliable.
Strategy Principle
The strategy consists of three main parts: EMA indicator, TTS trend tracking strategy and STC indicator.
Firstly, the 200-period EMA exponential moving average line is calculated. If the price is below this EMA line, the EMA indicator gives a sell signal: -1; if the price is above the line, the EMA indicator gives a buy signal: 1.
Secondly, the relevant parameters of the TTS trend tracking strategy are calculated. According to the price breakouts of the upper and lower rails, the market trend direction is determined. If the price breaks through the upper rail, a buy signal 1 is generated; if the price breaks through the lower rail, a sell signal -1 is generated.
Finally, the Schaff Trend Cycle (STC) indicator is calculated, which reflects the change trend of the price consolidation. If the STC indicator rises, it generates a buy signal 1; if the STC indicator falls, it generates a sell signal -1.
After obtaining the judgment signals from the three indicators, the strategy will determine whether they are consistent. Only when all three indicator judgment signals are consistent will actual trading signals be generated. This can effectively filter out some false signals and make the strategy more reliable.
Once determining to generate trading signals, long or short positions will be opened and stop-profit/stop-loss points will be set.
Advantages
-
The strategy combines three different types of indicators to effectively determine market trend direction.
-
Using the consistency of judgment signals from three indicators to filter out false signals can reduce unnecessary trades and make the strategy more reliable.
-
Setting reasonable stop-profit/stop-loss points can lock in profits and prevent losses from expanding.
-
The optimized parameters are suitable for most stocks and forex products.
-
Simple and easy-to-understand trading logic.
Risks
-
Inconsistency between indicator judgments may cause loss of trading opportunities. Judgment rules can be further optimized.
-
STC indicator is sensitive to parameters. Different products need parameter tuning.
-
In downtrends, stop loss may be penetrated, causing huge losses. Adaptive stop loss can be considered.
-
Sideway consolidations cannot be effectively identified, leading to trap positions.
Enhancements
-
Test more indicator combinations to find stronger judgment rules, e.g. adding RSI indicator.
-
Optimize STC parameters for better adaptation across different products. Add adaptive parameter optimization module.
-
Increase adaptive stop loss module to optimize stop loss points dynamically.
-
Enhance position closing module to identify sideway ranges and avoid traps.
-
Optimize algorithms for high frequency trading, reducing latency and improving order fulfillment rates.
Conclusion
The strategy combines EMA, TTS and STC indicators to determine market direction, with consistent judgments from all three triggering trades, effectively filtering out false signals. There is still large room for optimizations, e.g. testing more indicator combinations, adding adaptive algorithms, optimizing high frequency trading modules, etc, to further strengthen trend tracking capability. Compared to traditional strategies simply following moving averages, this strategy can judge markets more intelligently, capture trends while avoiding traps.
- 1