EVWMA Trend Following Strategy

Overview
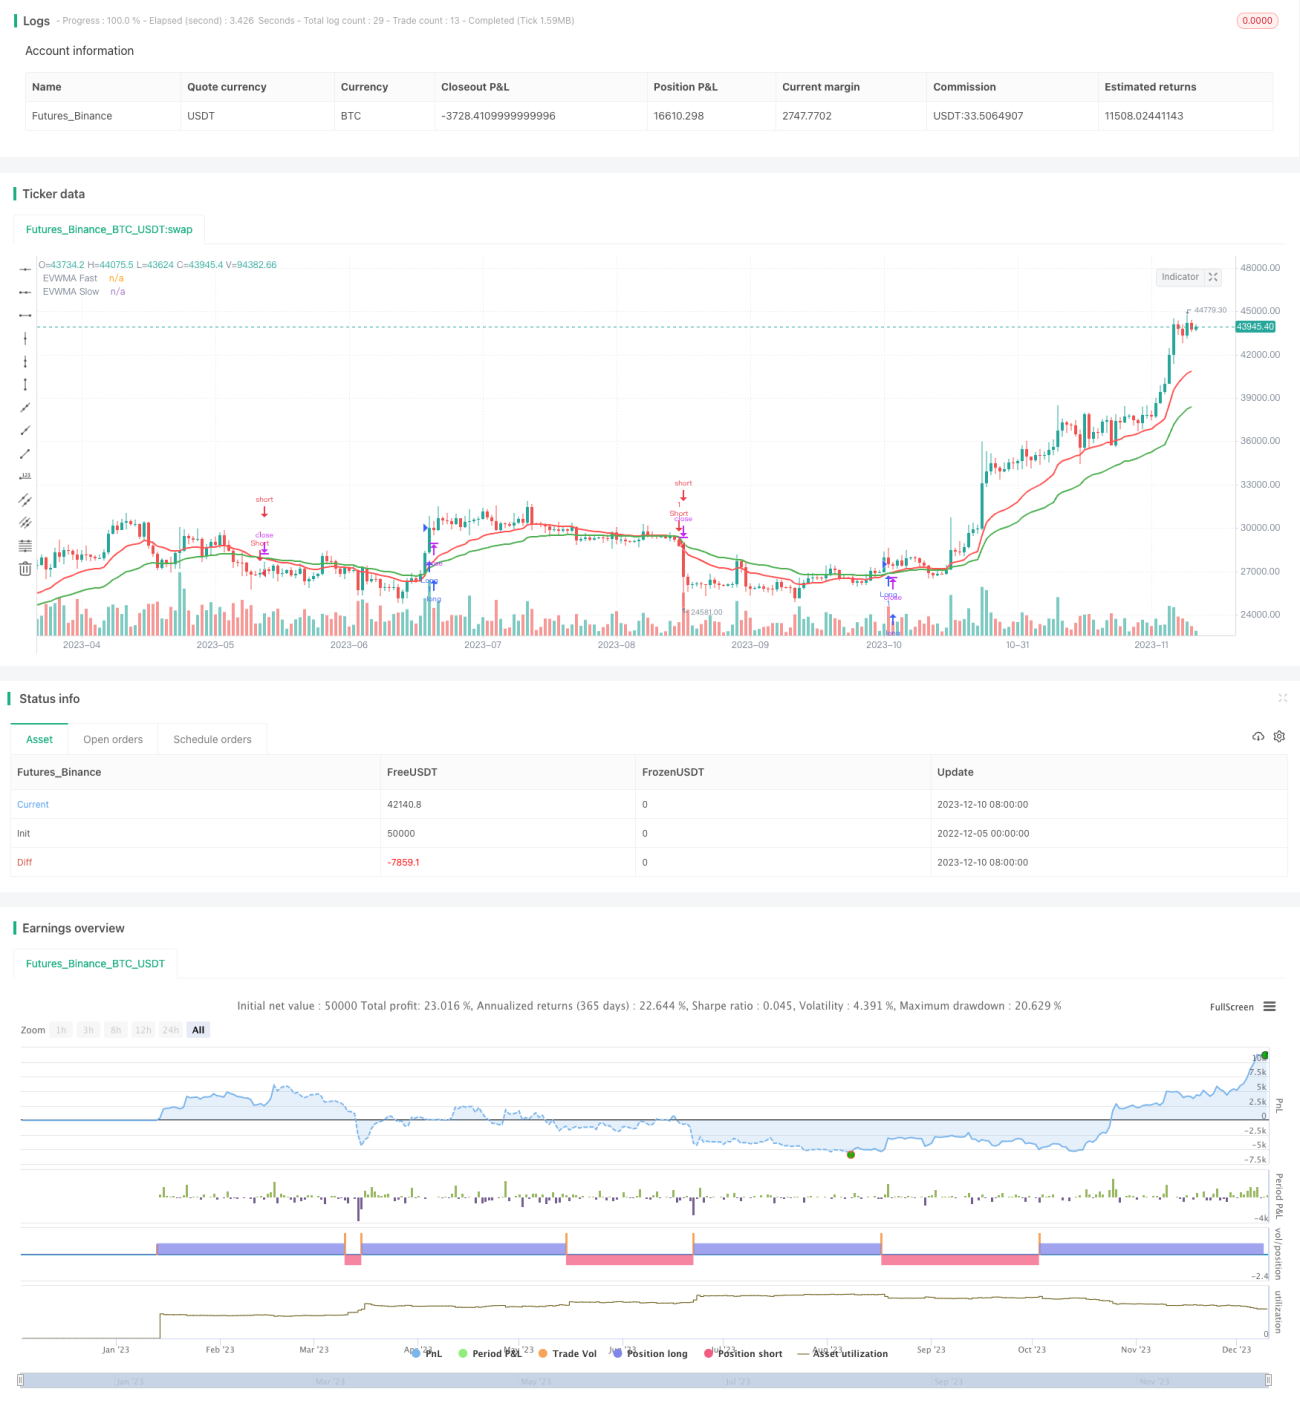
This strategy is designed as a simple trend following strategy based on the EVWMA indicator. It uses fast line and slow line to construct the EVWMA indicator. A long position will be opened when the fast line crosses over the slow line, and a short position will be opened when the fast line crosses below the slow line, to follow the trend.
Strategy Logic
The core indicator of this strategy is EVWMA, namely Elastic Volume Weighted Moving Average. It incorporates both price and volume information to reflect the market trend dynamically by calculating its own period.
Specifically, the period of the fast line is calculated as the sum of volume of recent 10 bars, and 20 bars for the slow line. The EVWMA of each bar is calculated as "(Previous bar's EVWMA × (Period length - Current bar's volume) + Current bar's close price × Current bar's volume) / Period length". In this way, it combines both price and volume information.
When the fast line crosses over the slow line, it indicates that the buying power is strengthening to go long. When the fast line crosses below the slow line, it indicates that the selling power is strengthening to go short. With such a combination of fast and slow lines, the strategy can capture the market trend dynamically to follow the trend.
Advantage Analysis
The biggest advantage of this strategy lies in the dynamic period design of the EVWMA indicator to respond faster to the changes in price and volume, thereby capturing the market trend in real time, which is very suitable for trend following strategies. Also, compared to traditional moving averages, it incorporates both price and volume information, which can filter false breakouts.
Risks and Solutions
The main risk of this strategy is the inappropriate parameter settings of the EVWMA indicator. If the periods of the fast and slow lines are not set properly, it may generate excessive false signals. Besides, trend following strategies themselves have some drawbacks when the market trend reverses sharply.
To solve these problems, we can optimize the parameters and adjust the calculation periods of fast and slow lines to find the best combination. Also, a stop loss can be set to control the risk of loss. Around time points when significant market reversal is likely to occur such as important data releases, we may consider temporarily suspending the strategy to avoid trades during this period.
Optimization Directions
There is room for further optimization of this strategy. For example, other indicators like breakout of trading volume, Bollinger Bands etc. can be incorporated to confirm the signals, thereby enhancing the stability of the strategy. Also, the optimal parameter values might differ across different products and time periods. An adaptive parameter optimization mechanism can be established to adjust parameters based on real-time data.
On the trading aspects, dynamic stop loss, trailing stop loss and other means can also be designed to control risks. In addition, an adaptive parameter mechanism may help obtaining optimal parameters across different products and time periods.
Summary
This strategy leverages the dynamic period design of the EVWMA indicator and incorporates volume information to construct an effective trend following strategy. It can respond quickly to price changes and capture market trends. With parameter optimization, risk control measures etc., the stability of the strategy can be further improved. The logic behind this strategy is innovative and worth further exploration and application.
- 1