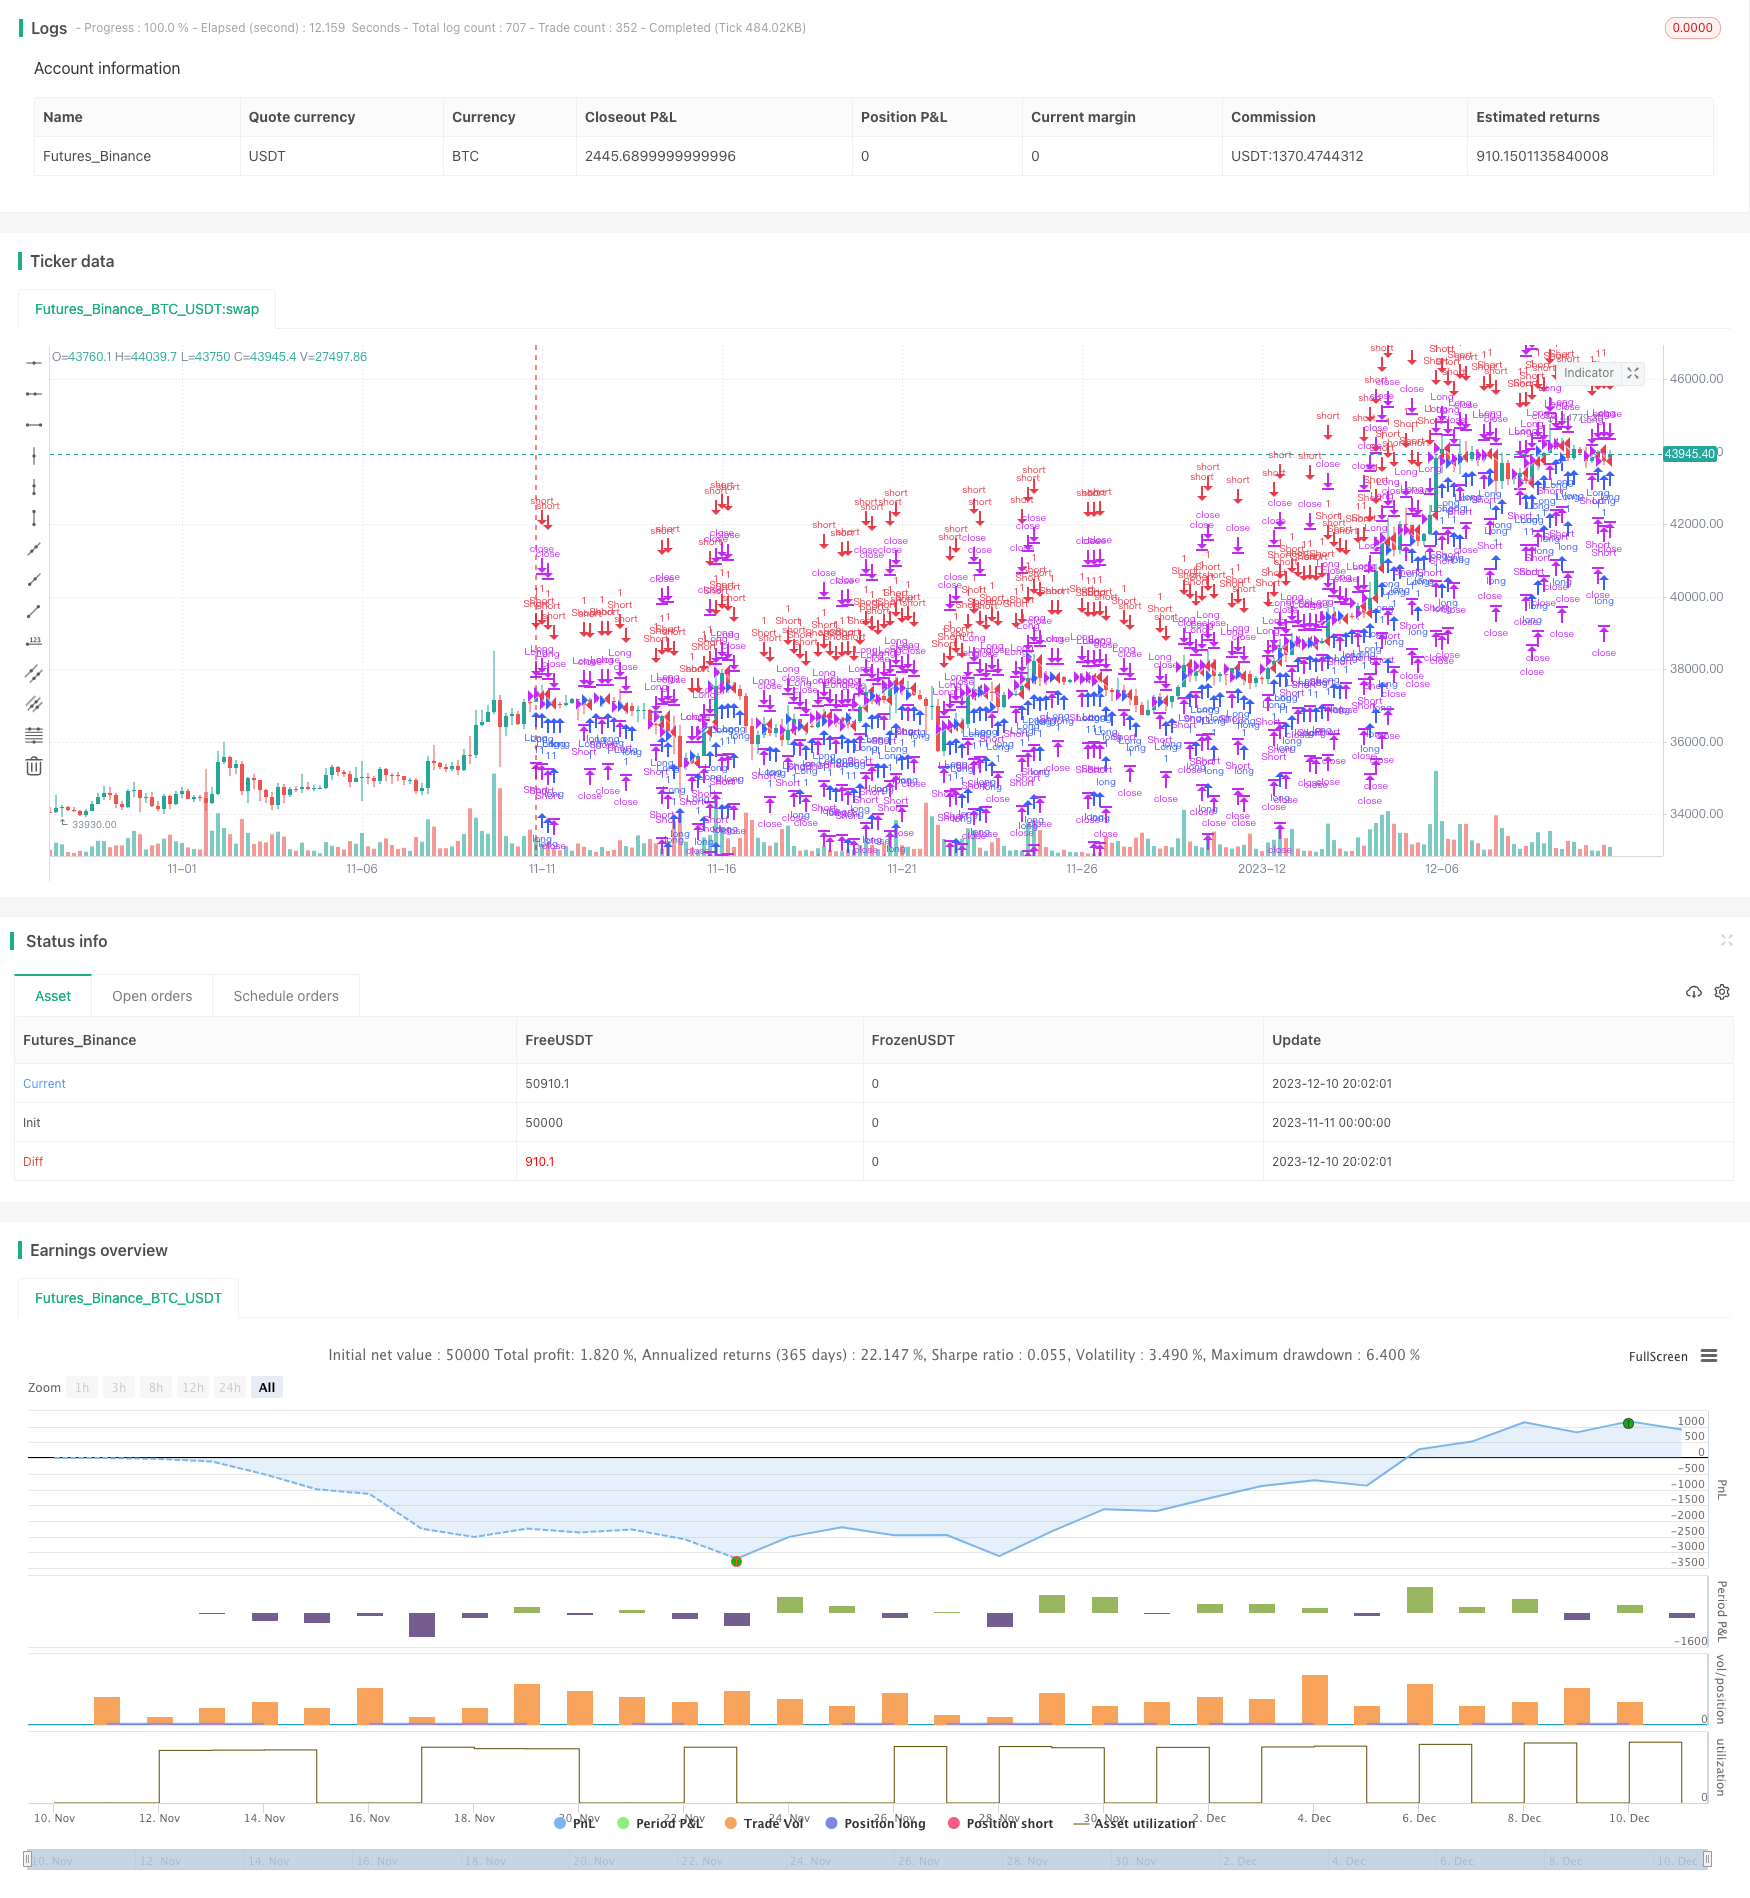
概述
本策略采用多重时间轴的均线系统,结合RSI指标等多种技术指标,实现多空自动切换。策略名称为“Multi-Timeframe Moving Average System Trading Strategy”,主要思想是通过比较不同时间段内价格的趋势判断,实现更加可靠的交易信号产生。
策略原理
该策略的核心指标为均线系统。策略使用 JMA、TEMA、DEMA 等多种均线指标在 15分钟、30分钟、60分钟等不同周期内计算价格趋势。例如 15周期内使用 JMA 计算出来的均线走势作为该周期内的价格趋势判断。然后策略将不同周期内的价格走势进行比较,判断长线与短线之间是否存在背离。如果存在显著的背离信号,则产生交易信号。此外,策略还结合 RSI、波浪指标等辅助判断,确保交易信号的可靠性。
具体来说,策略中的 trend、trend2 和 trend3 变量分别代表 15分钟、30分钟和 60 分钟的价格趋势。如果 15分钟价格反转,而 30分钟和 60 分钟还没有反转,那么就判断为短线和长线之间存在背离,则产生交易信号。如果所有周期趋势一致,则不产生交易信号。
这样通过比较多个周期之间的关系,过滤掉一些假信号,产生更加可靠的交易信号,这是该策略的核心思路。
优势分析
该策略主要具有以下优势:
- 使用多时间轴分析,提高信号的可靠性,过滤假信号;
- 结合多种指标进行综合判断,避免单一指标带来的问题;
- 自动实现多空头切换,无需人工干预,降低操作难度。
风险分析
该策略也存在一些风险:
- 多时间轴分析,将增加交易时点的不确定性,可能错过最佳进场时机;
- 同时结合多种指标,指标参数设置不当可能会产生交易信号质量下降的问题;
- 自动切换多空头存在过优化风险,实盘效果可能弱于回测。
针对上述风险,我们可以采取以下措施加以缓解:
- 调整时间轴参数,确保及时获知短线信号以 vez 进场;
- 通过大量数据回测,不断优化指标参数;
- 在实盘中适当干预,避免自动系统盲目交易。
优化方向
该策略还存在进一步优化的空间:
- 可以引入机器学习算法,通过模型训练自动优化多指标参数;
- 可以增加自适应滑点设置,根据市场波动程度调整滑点大小,提高实盘效果;
- 可以引入量价确认机制,避免趋势快速反转带来的损失。
总结
本策略通过比较多时间轴价格走势判断长短线关系,结合多种指标综合分析产生交易信号,实现自动多空头切换,回测效果较好。我们也发现该策略存在一定改进空间,未来通过引入机器学习、自适应滑点、量价确认等方法进行优化,可望进一步提高策略的实盘效果。
策略源码
/*backtest
start: 2023-11-11 00:00:00
end: 2023-12-11 00:00:00
period: 4h
basePeriod: 15m
exchanges: [{"eid":"Futures_Binance","currency":"BTC_USDT"}]
*/

//@version=2
strategy("Drexel Strategy", overlay=true )
Length1=7
Length2=9
Multiplier=input(1.5,"Multiplier")
jma(src,length) =>
    beta = 0.45*(length-1)/(0.45*(length-1)+2)
    alpha = beta
    tmp0 = (1-alpha)*src + alpha*nz(tmp0[1])
    tmp1 = (src - tmp0[0])*(1-beta) + beta*nz(tmp1[1])
    tmp2 = tmp0[0] + tmp1[0]
    tmp3 = (tmp2[0] - nz(tmp4[1]))*((1-alpha)*(1-alpha)) + (alpha*alpha)*nz(tmp3[1])
    tmp4 = nz(tmp4[1]) + tmp3[0]
    JMA = tmp4
    JMA
rsx(src,length) =>
    f90_ = (nz(f90_[1]) == 0.0) ? 1.0 : (nz(f88[1]) <= nz(f90_[1])) ? nz(f88[1])+1 : nz(f90_[1])+1
    f88 = (nz(f90_[1]) == 0.0) and (length-1 >= 5) ? length-1.0 : 5.0
    f8 =  100.0*(src)
    f18 = 3.0 / (length + 2.0)
    f20 = 1.0 - f18
    f10 = nz(f8[1])
    v8 = f8 - f10
    f28 = f20 * nz(f28[1]) + f18 * v8
    f30 = f18 * f28 + f20 * nz(f30[1])
    vC = f28 * 1.5 - f30 * 0.5
    f38 = f20 * nz(f38[1]) + f18 * vC
    f40 = f18 * f38 + f20 * nz(f40[1])
    v10 = f38 * 1.5 - f40 * 0.5
    f48 = f20 * nz(f48[1]) + f18 * v10
    f50 = f18 * f48 + f20 * nz(f50[1])
    v14 = f48 * 1.5 - f50 * 0.5
    f58 = f20 * nz(f58[1]) + f18 * abs(v8)
    f60 = f18 * f58 + f20 * nz(f60[1])
    v18 = f58 * 1.5 - f60 * 0.5
    f68 = f20 * nz(f68[1]) + f18 * v18
    f70 = f18 * f68 + f20 * nz(f70[1])
    v1C = f68 * 1.5 - f70 * 0.5
    f78 = f20 * nz(f78[1]) + f18 * v1C
    f80 = f18 * f78 + f20 * nz(f80[1])
    v20 = f78 * 1.5 - f80 * 0.5
    f0 = ((f88 >= f90_) and (f8 != f10)) ? 1.0  : 0.0
    f90 = ((f88 == f90_) and (f0 == 0.0))  ? 0.0  : f90_
    v4_ = ((f88 < f90) and (v20 > 0.0000000001)) ? (v14 / v20 + 1.0) * 50.0 : 50.0
    rsx = ((v4_ > 100.0) ? 100.0 : (v4_ < 0.0) ? 0.0 : v4_)-50
    rsx
xPrice=open
emaA = ema(xPrice, Length2)
Xprice = rsx(open,14)
XPrice = high, xprice = low
xe1 = jma(xPrice, Length1)
xe11 = jma(Xprice[1],Length1)
xe111 = jma(XPrice[1],Length1)
xe1111=jma(xprice[1],Length1)
xe2 = jma(xe1, Length1)
xe21 = jma(xe111, Length1)
xe3 = jma(xe2, Length1)
xe31 = jma(xe1111,Length2)
xe3a = jma(xe2,Length1)
xe4 = jma(xe3, Length1)
xe5 = jma(xe4, Length1)
xe6 = jma(xe5, Length1)
b = 0.7
c1 = -b*b*b
c2 = 3*b*b+3*b*b*b
c3 = -6*b*b-3*b-3*b*b*b
c3a = nz(c3a[1])
c4 = 1+3*b+b*b*b+3*b*b
TEMA = c1 * xe6 + c2 * xe5 + c3 * xe4 + c4 * xe3
DEMA = 2 * emaA - ema(emaA, Length2)
Length(mod)=>(mod*c3a)+Length2
Trend1=TEMA/DEMA
a=rsx(open,Length(2))
b1=rsx(open,Length(3))
c=rsx(open,Length(5))
d=rsx(open,Length(8))
e=rsx(open,Length(13))
f=rsx(open,Length(21))
g=rsx(open,Length(34))
h=rsx(open,Length(55))
i=rsx(open,Length(89))
j=rsx(open,Length(144))
trend1 = (((a-b1)+(c-d)+(e-f)+(g-h)+(i-j))/10)
trend = trend1>0?avg(a,b,c4,c2):trend1==0?XPrice:avg(rsx(open,24),jma(open,24),rsx(jma(open,24),24))
trend2 = trend1>0?avg(d,e,c2,c1):trend1==0?XPrice:avg(rsx(open,48),jma(open,48),rsx(jma(open,48),48))
trend3 = trend1>0?avg(d,e,c2,c1):trend1==0?xprice:avg(rsx(open,96),jma(open,96),rsx(jma(open,96),96))
bc=request.security(syminfo.tickerid,'15',trend)
bc1=request.security(syminfo.tickerid,'15',trend2)
bc2=request.security(syminfo.tickerid,'15',trend3)
bd=request.security(syminfo.tickerid,'30',trend)
bd1=request.security(syminfo.tickerid,'30',trend2)
bd2=request.security(syminfo.tickerid,'30',trend3)
be=request.security(syminfo.tickerid,'60',trend)
be1=request.security(syminfo.tickerid,'60',trend2)
be2=request.security(syminfo.tickerid,'60',trend3)
bf=request.security(syminfo.tickerid,'120',trend)
bf1=request.security(syminfo.tickerid,'120',trend2)
bf2=request.security(syminfo.tickerid,'120',trend3)
bg=request.security(syminfo.tickerid,'240',trend)
bg1=request.security(syminfo.tickerid,'240',trend2)
bg2=request.security(syminfo.tickerid,'240',trend3)
bh=request.security(syminfo.tickerid,'D',trend)
bh1=request.security(syminfo.tickerid,'D',trend2)
bh2=request.security(syminfo.tickerid,'D',trend3)
Trend=((bc-bc1)+(bd-bd1)+(be-be1)+(bf-bf1)+(bg-bg1)+(bh))
Trend11=((bc-bc1)+(bd-bd1)+(be-be1)+(bf-bf1)+(bg-bg1)+(bh1))
Trend33 = max(min(min(min(bc2,bd2),min(be2,bf2)),bg2),bh2)
AverageTrend=sma(Trend1,1000)
StdDev=Multiplier*stdev(Trend1,1000)
TopBand=AverageTrend+StdDev
BotBand=AverageTrend-StdDev
ap=open
n1=10
n2=21
esa1 = jma(ap, n1)
d1 = jma(abs(ap - esa1), n1)
x1 = trend3==Trend33
y1 = trend2==Trend11
ci = (ap - esa1) / (0.015 * d1)
tci = jma(ci, n2)
wt1=tci
wt2=sma(wt1,4)
fast=jma(open,5)
slow=jma(open,13)
macd=fast-slow
signal=sma(macd,4)
WaveTrend1=wt1-wt2
JMACD1=macd-signal
rsi = (((rsi(open,6))-50)*3)
g1=rsi>Trend1 and WaveTrend1>Trend1 and JMACD1>Trend1
h1=g1?tci*c3a:nz(h[1])
strategy.entry("Long",true,when=x1)
strategy.close("Long",y1)
strategy.entry("Short",false,when=y1)
strategy.close("Short",x1)