Pivot Points Breakout Strategy

Overview
The Pivot Points Breakout Strategy is a quantitative trading strategy that uses pivot points calculated based on the previous day's high, low and close prices, as well as upper and lower rails, to determine market trends and make trading decisions. The main idea of this strategy is to go long when prices break through the upper rail and go short when prices break through the lower rail.
Strategy Principle
The calculation formulas for the Pivot Points Breakout Strategy are as follows:
Pivot Price (PP) = (Previous day's high + Previous day's low + Previous day's close) / 3
First Resistance (R1) = (Pivot Price * 2) - Previous day's low
First Support (S1) = (Pivot Price * 2) - Previous day's high
The logic for trade signals is:
If close > First Resistance (R1), go long
If close < First Support (S1), go short
The main advantages of this strategy are:
- Uses previous day's data to calculate pivot points, responsive
- High probability of forming strong trends after breaking through upper/lower rails
- Simple and clear strategy rules, easy to implement
Advantage Analysis
The Pivot Points Breakout Strategy has the following advantages:
-
The calculation formula is simple and easy to implement. It only requires the previous day's high, low and close prices to calculate the pivot points and upper/lower rails.
-
It responds quickly. The pivot points and upper/lower rails update daily and can quickly capture price changes.
-
It captures trends early. Prices breaking through the upper/lower rails represent significant changes that may form new trends.
-
It has small drawdowns. Setting stop loss can limit downside risk.
-
It is easy to optimize. Parameters can be adjusted such as using different period data to calculate the pivot points.
Risk Analysis
The Pivot Points Breakout Strategy also has some risks:
-
Wrong breakout risk. Prices may temporarily break out incorrectly, leading to trading losses.
-
Market fluctuation risk. When the market fluctuates for an extended time, prices may touch the upper/lower rails multiple times leading to losses.
-
Parameter risk. If parameters are set inappropriately, such as the trading period is too short, it may also increase losses.
Countermeasures:
-
Set stop loss/take profit to strictly control risks.
-
Optimize parameters, adjust cycle length.
-
Combine with other indicators to filter signals.
Optimization Directions
The Pivot Points Breakout Strategy can also be optimized in the following aspects:
-
Cycle optimization. Test using longer cycle data such as weekly or monthly to calculate the pivot points.
-
Parameter optimization. Test adjusting the parameter values for the upper/lower rails, such as 1.5 or 2.5 etc.
-
Filter optimization. Combine with moving averages and other indicators to filter erroneous signals.
-
Risk control optimization. Set dynamic stop loss/take profit mechanisms, adjust stop loss price based on market changes.
Conclusion
Overall, the Pivot Points Breakout Strategy is a relatively simple and practical trend following strategy. It responds quickly to market changes and can effectively capture new trend formations. But there are also certain risks of wrong signals. By optimizing parameters, filtering signals and implementing risk control measures, the advantages can be maintained while controlling potential risks to improve the stability and profitability of the strategy.
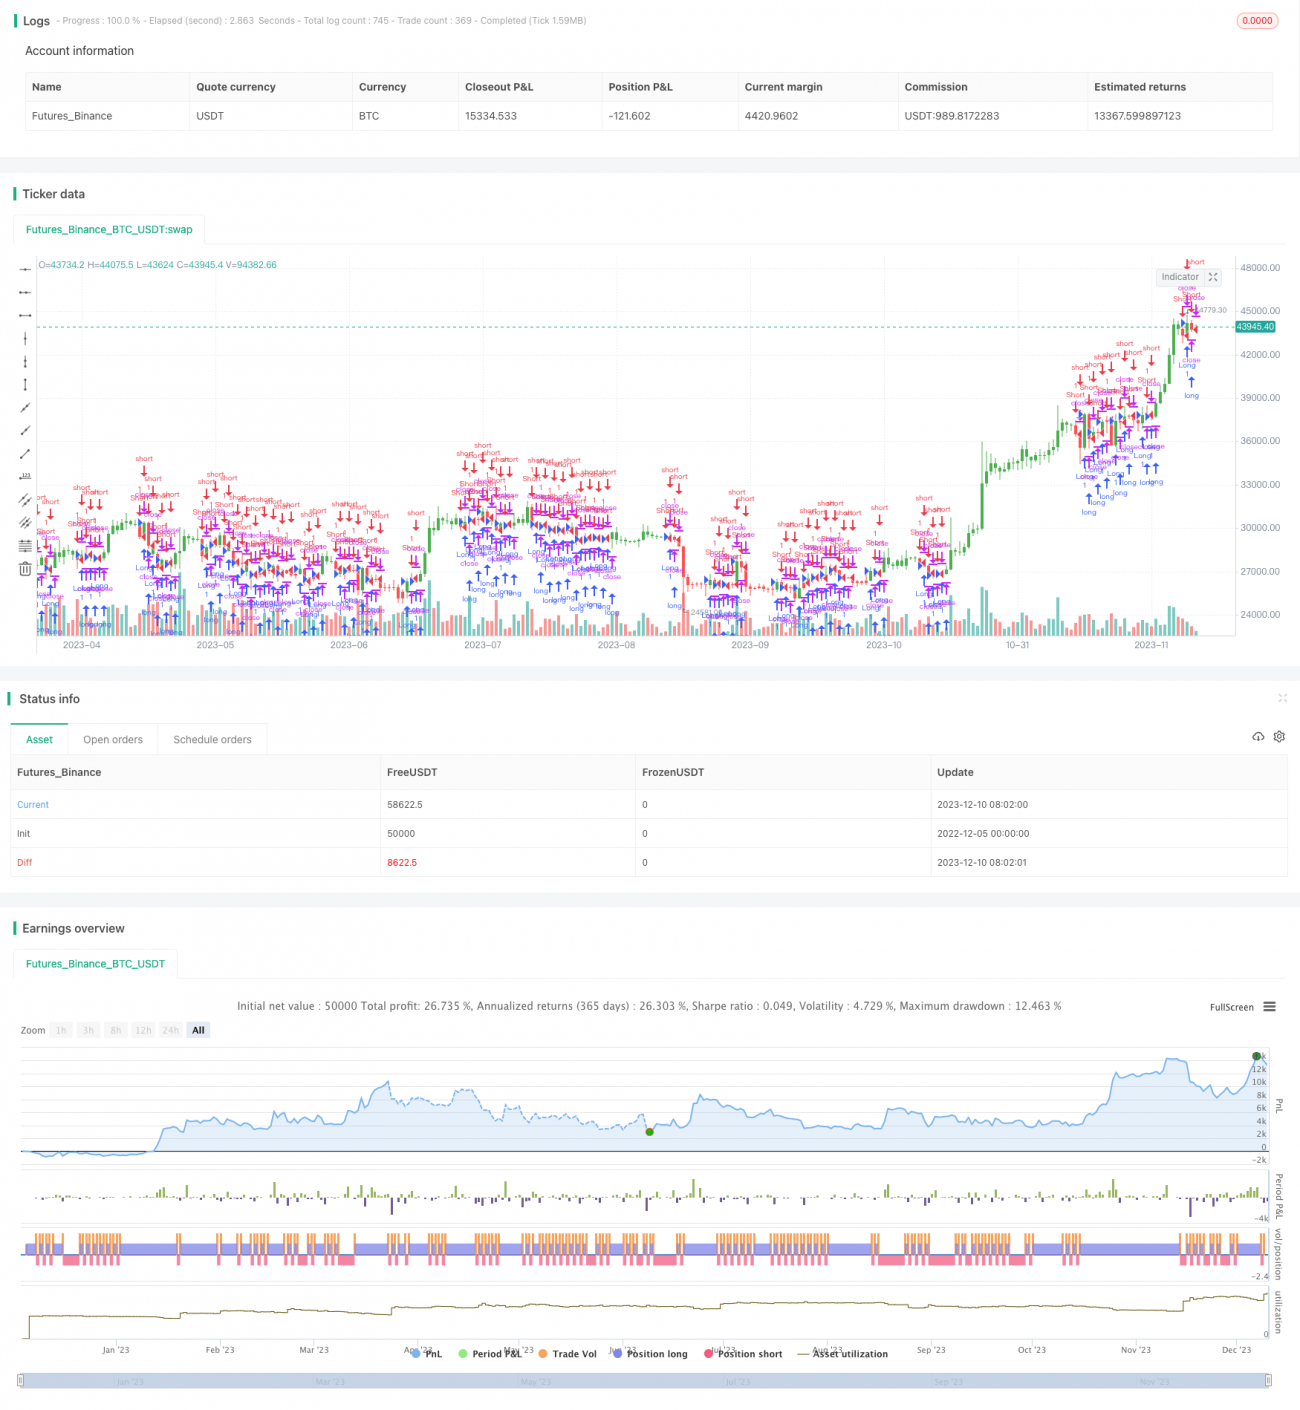
/*backtest
start: 2022-12-05 00:00:00
end: 2023-12-11 00:00:00
period: 1d
basePeriod: 1h
exchanges: [{"eid":"Futures_Binance","currency":"BTC_USDT"}]
*/

//@version=2
////////////////////////////////////////////////////////////
//  Copyright by HPotter v1.0 27/06/2018
// The name ‘Floor-Trader Pivot,’ came from the fact that Pivot points can - 1