EMA Crossover Trading Strategy

Overview
The EMA crossover trading strategy is a simple yet effective quantitative trading strategy. It utilizes exponential moving averages (EMA) and crossover signals to identify price trends and determine entry and exit points. Compared to more complex strategies, it is simpler to understand and implement.
Strategy Logic
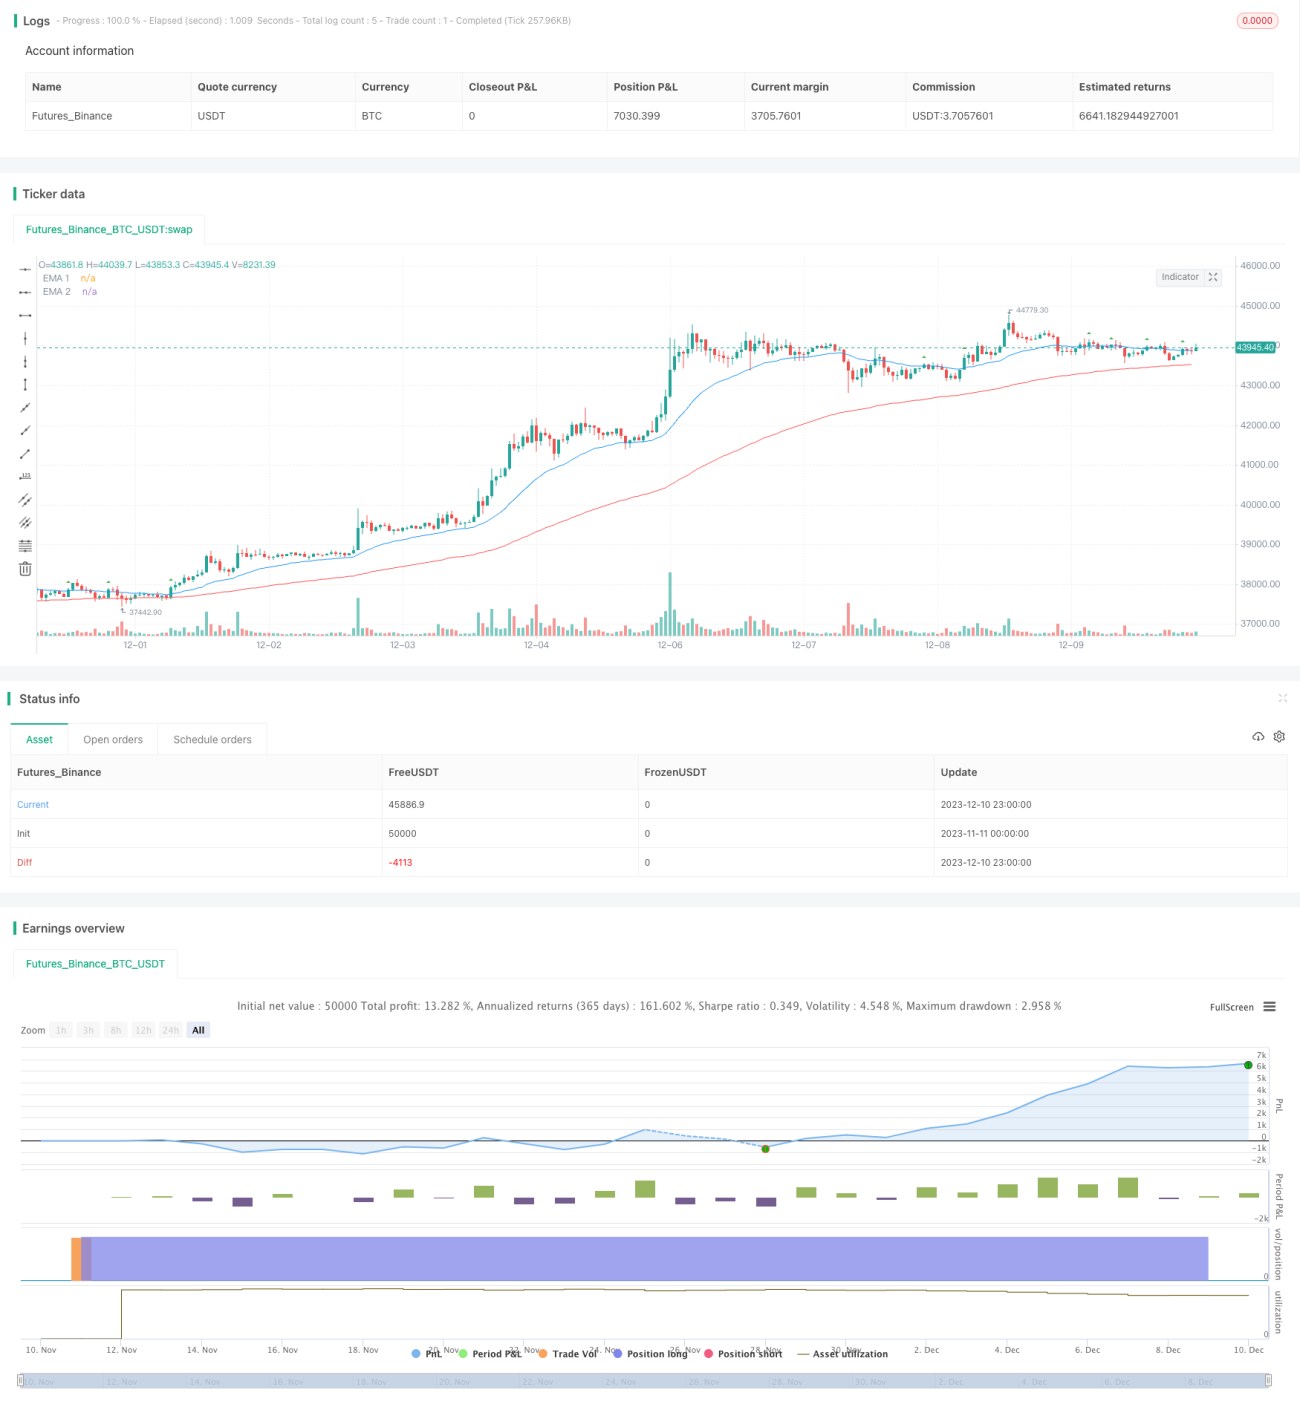
The key lies in using two EMAs with different parameters. EMA1 is set to 25 days and EMA2 is set to 100 days. When the shorter-term EMA crosses above the longer-term EMA, it is a buy signal. When the shorter EMA crosses below the longer EMA, it is a sell signal. Thus, the shorter EMA captures short-term price trends and momentum, while the longer EMA reflects long-term trends. The “golden cross” and “death cross” formed by the two EMAs generate trading signals.
To filter out false signals, the strategy also sets some additional criteria. For example, requiring a bullish candlestick pattern or crossover happening above 50 RSI level. This avoids erroneous trades due to short-term noise.
Advantages
The biggest advantage is the simplicity and intuitiveness of this strategy. Compared to strategies with numerous parameters and complex logic, it is much more user-friendly.
Also, it captures trend changes in both short-term and long-term timeframes, utilizing the classic technical indicator of EMA crosses to identify trend reversals and determine entries and exits, thus trading with the trend.
Lastly, appropriate filters are set to reduce false signals and avoid being misguided by market noise. This allows stable performance of the strategy in volatile markets.
Risks
The main risk is the divergence between short and long term trends. Dramatic price swings may trigger crossover signals but the longer-term trend remains unchanged, resulting in losing trades. Also, whipsaws often emerge in range-bound markets.
Inappropriate EMA period settings could also jeopardize strategy performance, as the representative power of the EMAs would diminish, rendering them ineffective in capturing trends and reversals. This introduces higher risks.
In addition, excessively strict filters may cause missing out potential trading opportunities, thus undermining profitability.
Enhancement
Combining with other indicators like KDJ, MACD etc. could help confirm trading signals and avoid false signals.
Testing different parameter sets to find optimal EMA periods, and adjusting filter criteria to balance trading frequency and reliability.
Dynamic position sizing is also important. For example, larger position when the two EMAs are further apart, smaller when closer. This adapts to changing market conditions.
Conclusion
The EMA crossover strategy is a simple yet practical quantitative trading strategy. It capitalizes on EMA crossover signals to trade along with short-term and long-term trends. Easy to understand and implement, it minimizes complexity and suits novice traders. However, its risks should not be neglected. Further optimization on parameters and filters can make the strategy more robust across varying markets.
/*backtest
start: 2023-11-11 00:00:00
end: 2023-12-11 00:00:00
period: 1h
basePeriod: 15m
exchanges: [{"eid":"Futures_Binance","currency":"BTC_USDT"}]
*/

//@version=5
strategy('EMA Crossover Signal', shorttitle='EMA Crossover Signal', overlay=true)
// Define input for position size as a percentage of equity
position_size_pct = input(1, title='Position Size (%)') / 100- 1