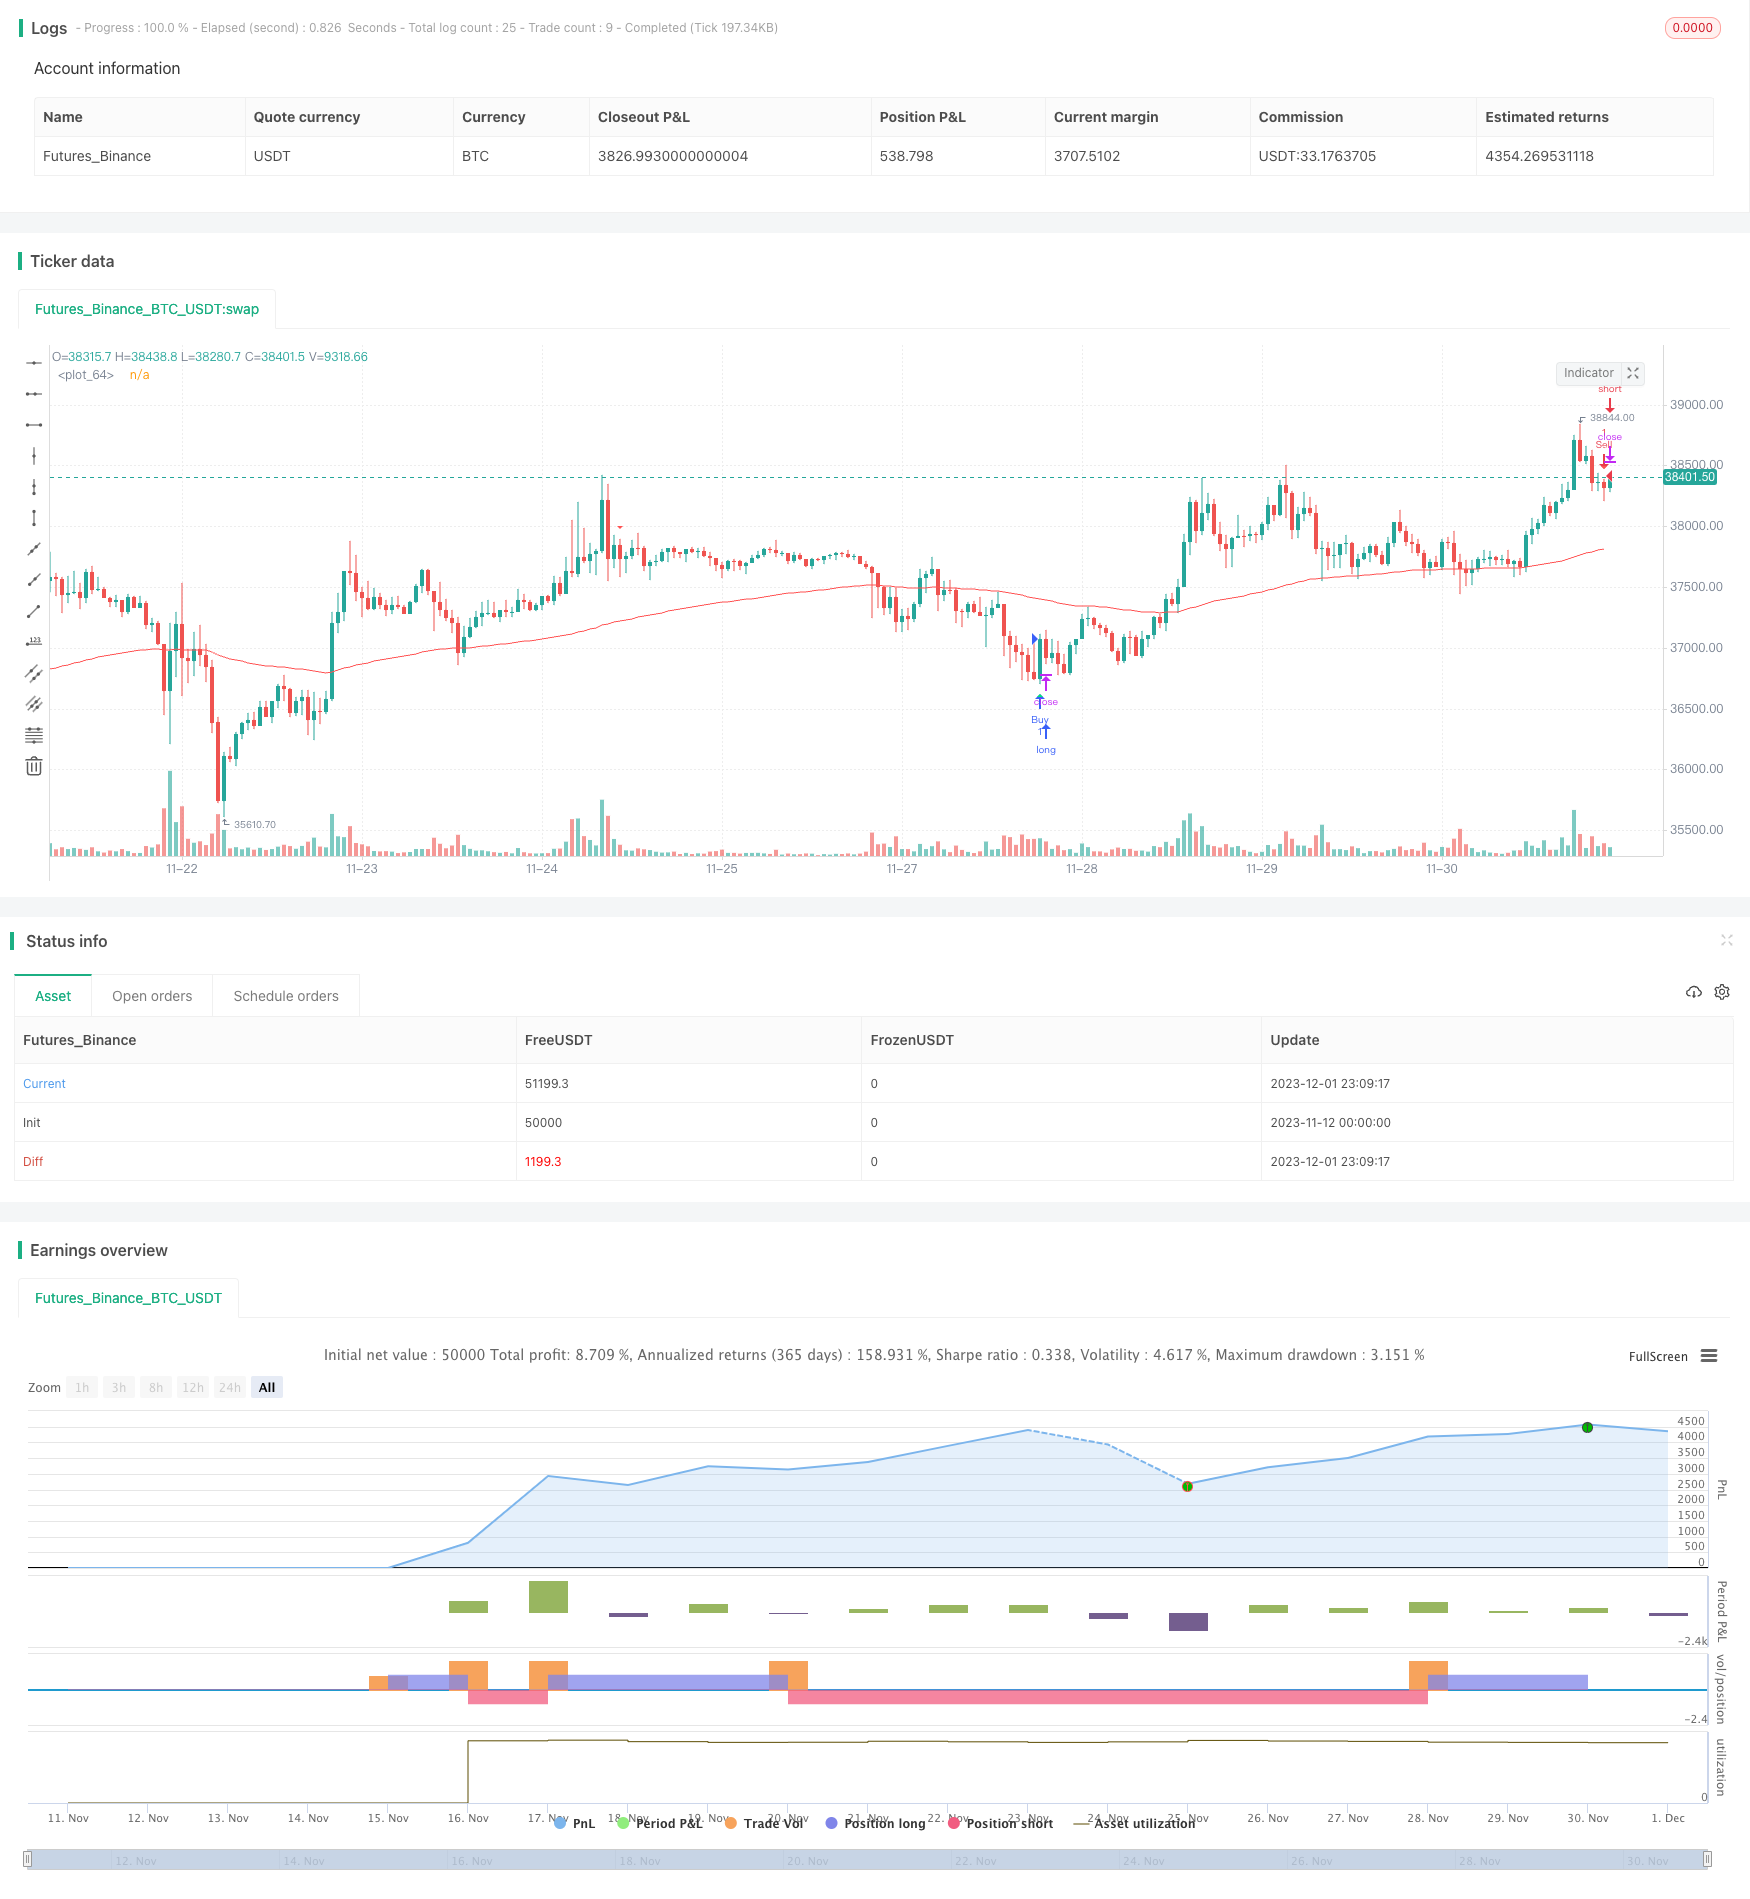
概述
这是一个基于多种技术指标的反转交易策略。它结合CCI、动量指标、RSI等指标识别潜在的多头和空头交易机会。当指标显示超买超卖信号且价格出现回调时,该策略会发出交易信号。
策略原理
该策略的交易信号来源于一个自定义的指标“Edri极点买卖点”,它综合考虑CCI、动量指标和RSI的交叉情况。具体逻辑是:
多头信号条件: 1. “Edri极点买卖点”指标发出买入信号,即CCI上穿0轴线或动量指标上穿0轴线,且RSI低于超卖线。 2. 价格拉回或低于100周期EMA。
空头信号条件: 1. “Edri极点买卖点”指标发出卖出信号,即CCI下穿0轴线或动量指标下穿0轴线,且RSI高于超买线。 2. 价格拉回或高于100周期EMA。
该策略还可选择配置寻找常规背离的条件,即RSI与价格出现明显的背离才产生交易信号。
当满足交易信号时,策略的止损位点为入场价±2ATR,止盈位点为入场价±4ATR。这可以根据市场波动程度设定合理的止损止盈范围。
优势分析
- 综合多个指标判断,有助于避免单一指标的假信号。
- 反转交易方式,有利于在震荡行情中捕捉中短线交易机会。
- ATR止损止盈方式,可以根据市场波动性智能调整仓位。
- 可寻找背离条件,避免在非极端超买超卖情况下打开仓位。
风险分析
- 指标参数设置不当可能导致错失交易机会或产生过多错误信号。
- 反转交易模式可能在趋势行情中连续止损。
- ATR有滞后性,在快速变动行情中无法及时更新止损止盈点位。
解决方法: 1. 对指标参数进行多次回测和优化,找出最佳参数组合。 2. 可考虑在趋势较强时暂停使用该策略。 3. 结合其他止损方式,如移动止损或违背止损。
优化方向
- 测试不同的参数组合,如CCI和动量指标周期、RSI参数、ATR倍数等。
- 增加其他辅助过滤条件,如价格模式、成交量变化等。
- 调整仓位管理方式,如根据ATR值设置仓位比例等。
- 设置不同品种、周期的参数模板。
- 考虑结合趋势跟踪机制,在趋势行情中暂停反转交易。
总结
该策略主要应用于震荡行情,通过捕捉中短线反转获得较稳定收益。它有助于识别价格短期拉伸现象,并基于多个指标判断产生交易信号。通过合理的参数优化和风险管理,可以有效利用该策略的优势。但仍需要注意反转交易固有的不足,在强趋势下持续亏损的可能性。总体上,该策略适用于有一定量化和风险管理经验的投资者。
策略源码
/*backtest
start: 2023-11-12 00:00:00
end: 2023-12-02 00:00:00
period: 1h
basePeriod: 15m
exchanges: [{"eid":"Futures_Binance","currency":"BTC_USDT"}]
*/

// This source code is subject to the terms of the Mozilla Public License 2.0 at https://mozilla.org/MPL/2.0/
// © MagicStrategies

//@version=5
strategy("Reversal Indicator Strategy", overlay = true)

// Input settings
ccimomCross = input.string('CCI', 'Entry Signal Source', options=['CCI', 'Momentum'], tooltip='CCI or Momentum will be the final source of the Entry signal if selected.')
ccimomLength = input.int(10, minval=1, title='CCI/Momentum Length')
useDivergence = input.bool(true, title='Find Regular Bullish/Bearish Divergence', tooltip='If checked, it will only consider an overbought or oversold condition that has a regular bullish or bearish divergence formed inside that level.')
rsiOverbought = input.int(65, minval=1, title='RSI Overbought Level', tooltip='Adjusting the level to extremely high may filter out some signals especially when the option to find divergence is checked.')
rsiOversold = input.int(35, minval=1, title='RSI Oversold Level', tooltip='Adjusting this level extremely low may filter out some signals especially when the option to find divergence is checked.')
rsiLength = input.int(14, minval=1, title='RSI Length')
plotMeanReversion = input.bool(false, 'Plot Mean Reversion Bands on the chart', tooltip='This function doesn\'t affect the entry of signal but it suggests buying when the price is at the lower band, and then sell it on the next bounce at the higher bands.')
emaPeriod = input(200, title='Lookback Period (EMA)')
bandMultiplier = input.float(1.8, title='Outer Bands Multiplier', tooltip='Multiplier for both upper and lower bands')


// CCI and Momentum calculation
momLength = ccimomCross == 'Momentum' ? ccimomLength : 10
mom = close - close[momLength]
cci = ta.cci(close, ccimomLength)
ccimomCrossUp = ccimomCross == 'Momentum' ? ta.cross(mom, 0) : ta.cross(cci, 0)
ccimomCrossDown = ccimomCross == 'Momentum' ? ta.cross(0, mom) : ta.cross(0, cci)

// RSI calculation
src = close
up = ta.rma(math.max(ta.change(src), 0), rsiLength)
down = ta.rma(-math.min(ta.change(src), 0), rsiLength)
rsi = down == 0 ? 100 : up == 0 ? 0 : 100 - 100 / (1 + up / down)
oversoldAgo = rsi[0] <= rsiOversold or rsi[1] <= rsiOversold or rsi[2] <= rsiOversold or rsi[3] <= rsiOversold
overboughtAgo = rsi[0] >= rsiOverbought or rsi[1] >= rsiOverbought or rsi[2] >= rsiOverbought or rsi[3] >= rsiOverbought

// Regular Divergence Conditions
bullishDivergenceCondition = rsi[0] > rsi[1] and rsi[1] < rsi[2]
bearishDivergenceCondition = rsi[0] < rsi[1] and rsi[1] > rsi[2]

// Entry Conditions
longEntryCondition = ccimomCrossUp and oversoldAgo and (not useDivergence or bullishDivergenceCondition)
shortEntryCondition = ccimomCrossDown and overboughtAgo and (not useDivergence or bearishDivergenceCondition)


// Mean Reversion Indicator
meanReversion = plotMeanReversion ? ta.ema(close, emaPeriod) : na
stdDev = plotMeanReversion ? ta.stdev(close, emaPeriod) : na
upperBand = plotMeanReversion ? meanReversion + stdDev * bandMultiplier : na
lowerBand = plotMeanReversion ? meanReversion - stdDev * bandMultiplier : na


// Plotting
plotshape(longEntryCondition, title='BUY', style=shape.triangleup, text='B', location=location.belowbar, color=color.new(color.lime, 0), textcolor=color.new(color.white, 0), size=size.tiny)
plotshape(shortEntryCondition, title='SELL', style=shape.triangledown, text='S', location=location.abovebar, color=color.new(color.red, 0), textcolor=color.new(color.white, 0), size=size.tiny)

plot(upperBand, title='Upper Band', color=color.new(color.fuchsia, 0), linewidth=1)
plot(meanReversion, title='Mean', color=color.new(color.gray, 0), linewidth=1)
plot(lowerBand, title='Lower Band', color=color.new(color.blue, 0), linewidth=1)

// Entry signal alerts
alertcondition(longEntryCondition, title='BUY Signal', message='Buy Entry Signal')
alertcondition(shortEntryCondition, title='SELL Signal', message='Sell Entry Signal')
alertcondition(longEntryCondition or shortEntryCondition, title='BUY or SELL Signal', message='Entry Signal')

ema100 = ta.ema(close, 100)
plot(ema100, color=color.red)

// Define trading signals based on the original indicator's entry conditions
// Buy if long condition is met and price has pulled back to or below the 100 EMA
longCondition  = longEntryCondition and close <= ema100
// Sell if short condition is met and price has pulled back to or above the 100 EMA
shortCondition = shortEntryCondition and close >= ema100

// Strategy Entries
if longCondition
    strategy.entry("Buy", strategy.long)
if shortCondition
    strategy.entry("Sell", strategy.short)