Trend Reversal Strategy Based on Accelerator Oscillator

Overview
This strategy is based on the Accelerator Oscillator (AC) indicator developed by Bill Williams to identify trend reversal points and capture trading opportunities. The indicator represents the difference between the Awesome Oscillator (AO) and its 5-period simple moving average, reflecting the rate of change of AO. When AO crosses above its moving average, it signals accelerating bullish momentum and is a signal to establish long positions. On the contrary, when AO crosses below its moving average, it signals accelerating bearish momentum and is a signal to establish short positions.
Strategy Logic
The strategy calculates the difference between AO and its 5-period moving average to obtain the Accelerator Oscillator (AC). When AC is positive, it represents acceleration in the rise of AO, indicating strengthening bullish momentum. When AC is negative, it represents acceleration in the fall of AO, indicating strengthening bearish momentum.
The strategy determines long/short position based on the positive/negative value of AC. When AC crosses above 0, it is considered that bullish momentum is accelerating, hence a long position is established. When AC crosses below 0, it is considered that bearish momentum is accelerating, hence a short position is established.
Specifically, the strategy calculates the fast line and slow line of the Awesome Oscillator (AO):
AO Fast Line = SMA(HL2, LengthFast)
AO Slow Line = SMA(HL2, LengthSlow)
Then calculate AO:
AO = AO Fast Line – AO Slow Line
Next calculate the 5-period moving average of AO:
AO Moving Average = SMA(AO, LengthFast)
Finally obtain the Accelerator Oscillator:
AC = AO – AO Moving Average
When AC crosses above 0, establish long position. When AC crosses below 0, establish short position.
Advantages
The strategy has the following advantages:
-
Using the Accelerator Oscillator indicator can discover trend reversal earlier than other indicators like simple moving average.
-
Using the crossovers between AO and its moving average as trading signals can effectively filter out market noise and identify trend reversals.
-
The strategy logic is simple and easy to understand and modify, suitable as a basic framework for strategy development.
-
The periods of the AO fast line and slow line can be customized for performance optimization.
Risks
The strategy also has the following risks:
-
AC indicator tends to generate false signals, resulting in over-trading and increased costs and risks.
-
No stop loss mechanism, may lead to amplified losses.
-
Backtest results may have overfitting risks, real trading effect is questionable.
-
Ignoring overall market conditions may lead to trading failures.
Improvement
The strategy can be improved from the following aspects:
-
Add other indicators such as MACD, KDJ to filter signals and avoid false breakouts.
-
Add moving stop loss mechanism to control single trade loss.
-
Evaluate the Parameter Optimization feature to find the optimal parameter combinations.
-
Use different parameters for different products and timeframes to make the strategy more robust.
-
Incorporate analysis of overall market trends in higher timeframes.
Summary
This simple trend reversal trading strategy based on the Accelerator Oscillator is designed by calculating the difference between AO and its moving average to determine trading signals. Although it tends to generate false signals, it can serve as a basic framework for strategy development. By incorporating other factors for filtration and optimization, the strategy performance can be effectively improved and is worth further research.
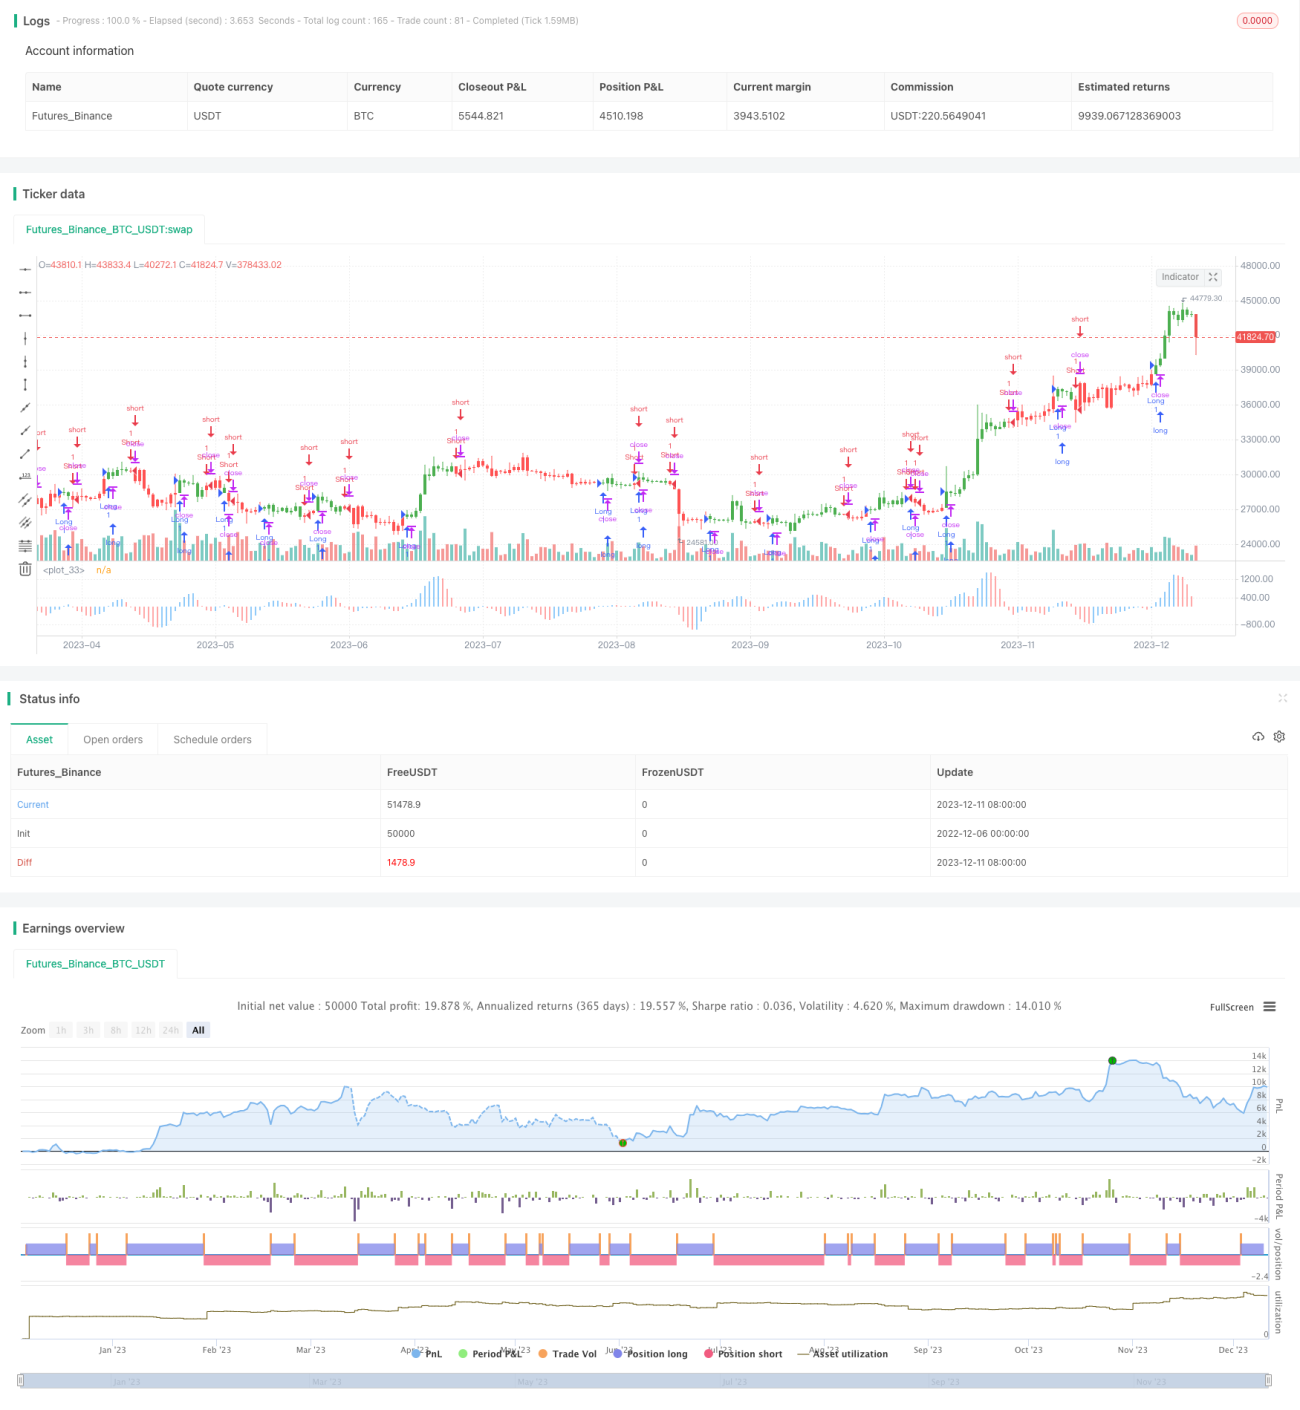
/*backtest
start: 2022-12-06 00:00:00
end: 2023-12-12 00:00:00
period: 1d
basePeriod: 1h
exchanges: [{"eid":"Futures_Binance","currency":"BTC_USDT"}]
*/

//@version=2
////////////////////////////////////////////////////////////
//  Copyright by HPotter v1.0 01/06/2017
// The Accelerator Oscillator has been developed by Bill Williams - 1