Dynamic Price Channel Breakout Strategy

Overview
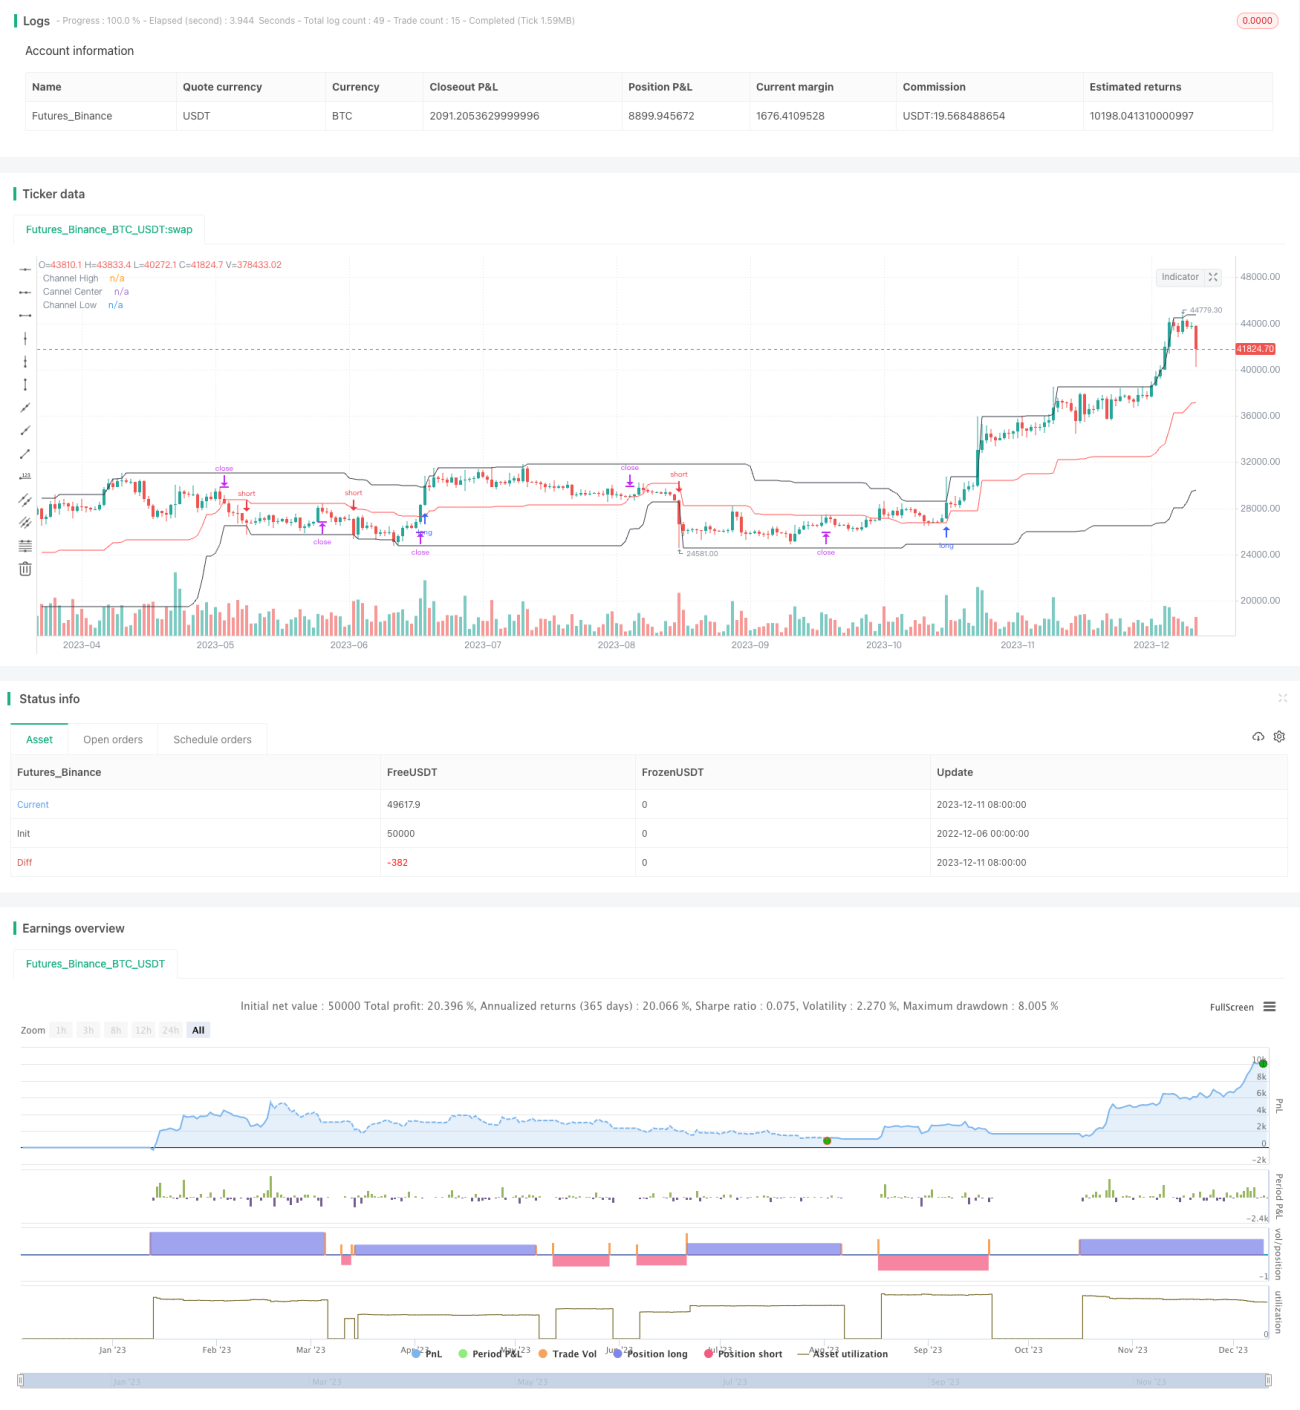
The Dynamic Price Channel Breakout Strategy is a quantitative trading strategy based on the Donchian Price Channel indicator. The strategy judges market trend direction according to the upper and lower lines of the price channel, and establishes long or short positions when prices break through the channel.
The main idea of this strategy is Using breakouts of the Donchan price channel. When the price breaks through the upper limit of the channel, establish a long position to seek the trend; When the price breaks through the lower limit of the channel, establish a short position to seek the trend.
Strategy Principle
Indicator Calculation
The price channel is calculated by the following formulas:
Upper Line = Highest high over the past N periods
Lower Line = Lowest low over the past N periods
Middle Line = (Upper Line + Lower Line) / 2
Where N represents the length of the channel cycle. The default is 50 for this strategy.
Entry Rules
When the highest price of the latest K-line breaks through the upper limit of the channel, establish a long position;
When the lowest price of the latest K-line breaks through the lower limit of the channel, establish a short position.
Example:
The high point of the previous K-line did not exceed the upper limit of the channel;
The high point of the current K-line breaks through the upper limit of the channel;
==> Establish a long position
Exit Rules
There are two optional exit rules:
- Channel Exit
Close long position: Stop loss price is the lower limit of the channel;
Close short position: Stop loss price is the upper limit of the channel;
- Middle Line Exit
No matter long or short positions, close all positions when prices fall back below the middle line of the channel.
Risk Control
Risk control adopts proportional stop loss to calculate specific stop loss distance based on channel amplitude and acceptable risk percentage.
Long stop loss distance = Entry price * (1 - Acceptable risk percentage)
Short stop loss distance = Entry price * (1 + Acceptable risk percentage)
For example, if the acceptable risk is set at 2%, the entry price is $10,000, then the stop loss line for long position is 10,000 * (1 - 2%) = $9,800.
Advantage Analysis
Capture Trend Breakouts
When prices break through the upper and lower limits of the channel, it is highly probable that a new directional trend begins. Taking positions at this time can capture relatively large price movements.
Controllable Risks
The use of proportional stop loss can keep single losses within an acceptable range.
Large Parameter Optimization Space
Parameters like channel cycle, risk ratio, stop loss method can be optimized and combined to adapt more market environments.
Risk Analysis
Failed Breakouts
Price breakouts of channel limits do not necessarily form a trend, there is a probability of failed breakouts, which is likely to cause a stop loss.
Range-bound Market
When the market is range-bound, prices may frequently touch the upper and lower limits of the channel, resulting in excessive frequent trading, thus increasing transaction costs and slippage losses.
Optimization Directions
Dynamic Channel
Consider making the length of the price channel a variable that automatically adjusts based on market volatility. Increase the channel length when the market oscillates and decrease the channel length when the trend is clear.
Optimize Entry Opportunities
Combine other indicators to filter entry timing, such as volume indicators, moving averages, etc. to avoid ineffective breakouts in oscillating markets.
Parameter Optimization
Use more historical data to test and optimize parameter combinations to determine the optimal parameters to adapt to wider market conditions.
Summary
The Dynamic Price Channel Strategy is generally a relatively simple and intuitive trend tracking strategy. Its advantages are clear signals and easy to grasp; The risk control is relatively reasonable. But there are still some problems to be further optimized, such as handling failed breakouts and oscillating markets. This strategy is more suitable as an auxiliary tool for trend trading, and the effect will be better when combined with other technical indicators or models.
/*backtest
start: 2022-12-06 00:00:00
end: 2023-12-12 00:00:00
period: 1d
basePeriod: 1h
exchanges: [{"eid":"Futures_Binance","currency":"BTC_USDT"}]
*/

//Noro

//@version=4
strategy(title = "Noro's RiskChannel Strategy", shorttitle = "RiskChannel str", overlay = true, default_qty_type = strategy.percent_of_equity, initial_capital = 100, default_qty_value = 100, pyramiding = 0, commission_value = 0.1)- 1