Compound Quantitative Trading Strategy Based on MACD

Overview
This is a compound quantitative trading strategy based on the MACD indicator. It combines multiple indicators such as MACD and KDJ to generate trading signals through the combination of indicators.
Strategy Principle
The core indicator of this strategy is MACD. MACD stands for Moving Average Convergence Divergence, which is a trend-following indicator. It consists of a fast moving average (EMA) and a slow moving average (EMA). The default parameters are 12 for the fast line and 26 for the slow line. The strategy calculates the difference between the two EMA lines, called the DIF. Then a 9-day EMA is calculated on the DIF to get the DEA indicator. When the DIF crosses above the DEA, a buy signal is generated. When crossing below, a sell signal is generated.
The strategy also incorporates the KDJ indicator. The KDJ indicator includes the K value, D value, and J value. Among them, the K value refers to the random value, the D value is the moving average of the K value, and the J value refers to the deterministic value. The KDJ indicator reflects the overbought and oversold levels in the market. When the J value is greater than 100, it represents overbought conditions. When less than 10, it represents oversold conditions. The strategy combines the KDJ indicator to avoid generating wrong signals at market turning points.
Advantages of the Strategy
The strategy combines multiple indicators such as MACD and KDJ, which can effectively filter out market noise and identify trend directions. The MACD indicator can capture short-term price changes in a timely manner, while the KDJ indicator can confirm medium and long term trends. The combination of the two can balance the pursuit of agility and stability.
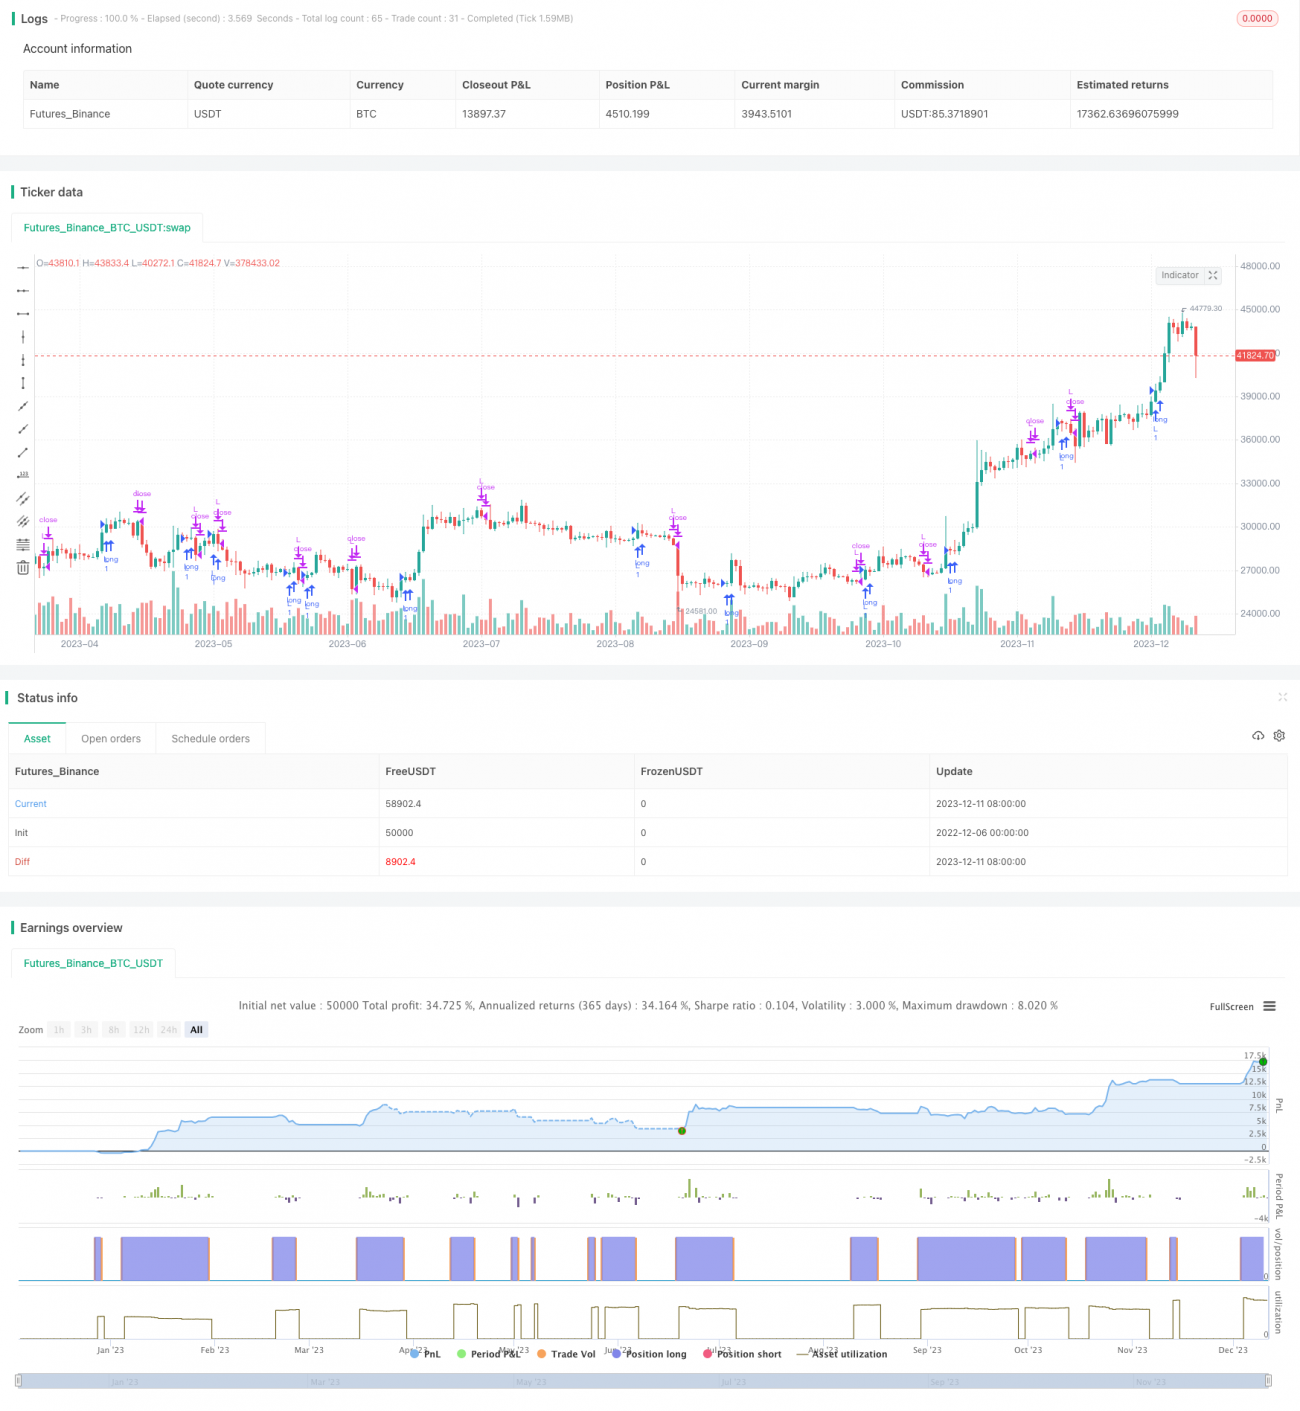
In addition, the strategy incorporates a time range selector, which provides greater flexibility in evaluating strategy performance.
Risks and Solutions
-
When the market fluctuates for an extended period, MACD will have multiple false signals. At this point, we can properly adjust the parameters of the EMA lines to filter out some noise.
-
Improper KDJ parameter settings will also affect results. We can test multiple parameter groups and select a more stable parameter combination.
-
Inappropriate selection of backtest timeframe will overestimate or underestimate the profitability of the strategy. Representative timeframes should be chosen for testing.
Optimization Directions
The strategy can be optimized in the following aspects:
-
Add a stop loss mechanism. When the price triggers the stop loss line, it will force a position exit for stop loss purposes.
-
Incorporate more indicator filters, combining indicators such as RSI and Bollinger Bands to improve signal accuracy.
-
Optimize indicator parameters. Change the combination of EMA and KDJ parameters to find the optimal settings.
-
Use machine learning techniques to automatically optimize. Use neural networks for parameter training and optimization.
Conclusion
This is a typical quantitative strategy that mainly follows the trend, supplemented by overbought and oversold control. It combines the advantages of multiple indicators and effectively balances stability and sensitivity. Through continuous optimization and adjustment, the applicability of the strategy can be further expanded to obtain long-term steady profits.
- 1