Supertrend Blind Following Strategy

Overview
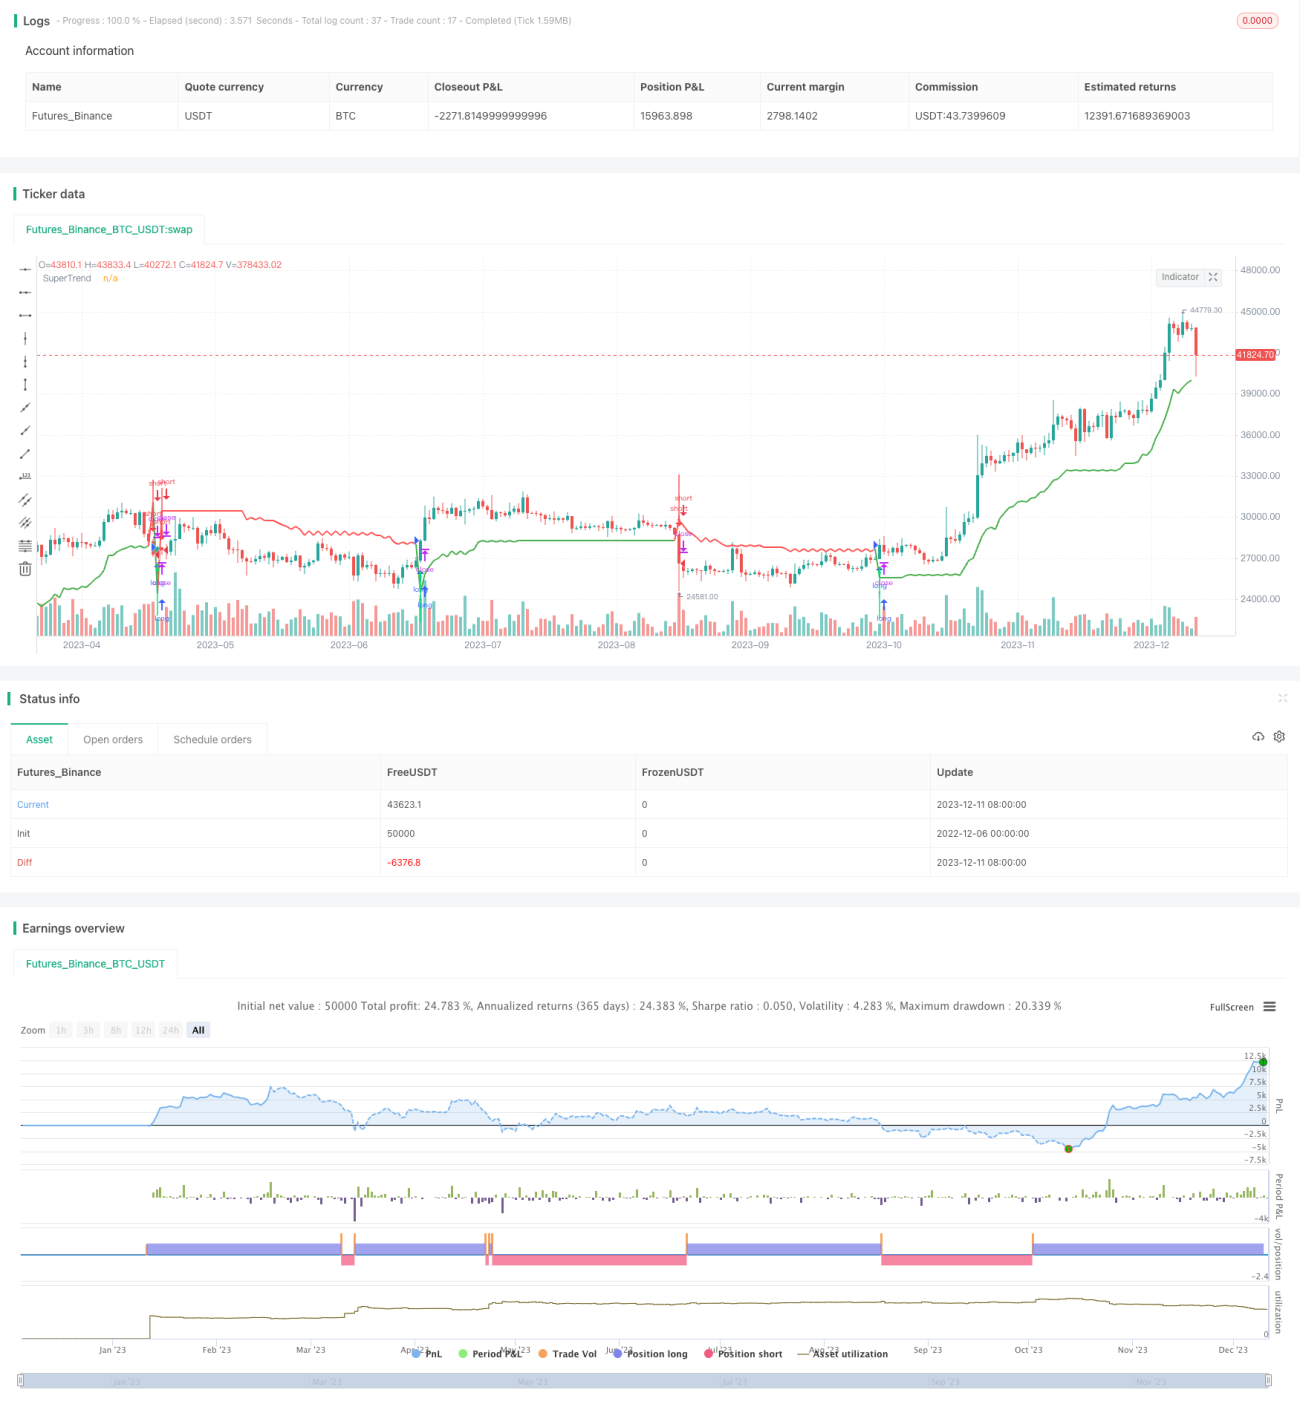
This strategy shows what would happen if you blindly follow the Supertrend indicator. As we know, Supertrend does not appear immediately and we need to wait for the next bar to decide whether to enter a position. So you can see what will happen if you take a position after Supertrend finally formed. This indicator is extremely dangerous without other tools and can give very serious drawdowns. Take care of yourself...
Strategy Logic
This strategy uses the Supertrend indicator to determine price trend. Supertrend is built based on the Average True Range and midpoints of high and low prices.
When the close price is above the upper rail, it represents a sustained uptrend; when the close price is below the lower rail, it represents a sustained downtrend.
This strategy sets two parameters: Factor and Pd. Factor controls the width of the Supertrend channel, and Pd controls the period length to calculate ATR. Based on these two parameters, the upper and lower rails can be constructed.
Upper Rail Formula: hl2 - (Factor * ATR(Pd))
Lower Rail Formula: hl2 + (Factor * ATR(Pd))
Where hl2 represents the midpoint of high and low prices.
Then compare the current close price with the upper and lower rails to determine if it's an uptrend or a downtrend, and output a boolean Trend variable.
Plot the upper and lower rails of Supertrend based on Trend. And place entry and exit signals when Trend status changes.
Set strategy's entry logic based on the signals.
Advantage Analysis
This strategy has the following advantages:
-
Uses Supertrend indicator, which can clearly determine price trend and pivot points.
-
Sets clear entry and exit logic.
-
Visualizes entry timing with arrows.
-
Simple and easy to understand strategy logic.
Risk Analysis
This strategy has the following risks:
-
Blindly following Supertrend without other auxiliary indicators and money management may lead to huge drawdowns.
-
No stop loss set, unable to control single loss.
-
Signals may lag, unable to enter in time around turning points.
-
Improper parameter settings may cause Supertrend channel to be too wide or too narrow.
Risk Management Measures:
-
Combine with other indicators like MACD, KDJ for effectiveness validation, avoid blind following.
-
Set reasonable stop loss to maximize control over single loss.
-
Adjust parameters to make Supertrend channel reasonable, prevent too wide or too narrow.
Optimization Directions
This strategy can be optimized in the following aspects:
-
Add auxiliary indicators for effectiveness validation to prevent failure. For example, MACD indicator can be considered.
-
Set reasonable stop loss logic. Can set percentage stop loss based on ATR.
-
Optimize hyperparameters Factor and Pd to find best parameter combinations. For example, traversal methods can be used to find optimal parameters.
-
Optimize entry timing to avoid signal lag. For example, momentum indicators can be introduced to adjust entry timing based on strength and weakness.
-
Add position sizing strategies. For example, fixed fractional position sizing can be adopted.
Conclusion
This strategy uses Supertrend indicator to determine price trend and find turning points. Blindly following Supertrend without auxiliary indicators and stop loss means brings huge risks. We proposed improvements in aspects like risk management, stop loss strategies, parameter optimization, entry timing, etc, which can significantly enhance the stability and profitability of the strategy.
- 1