Bollinger Fibonacci Grid Tracking Trend Strategy

Author: ChaoZhang, Date: 2023-12-13 17:12:38
Tags:

img

Overview

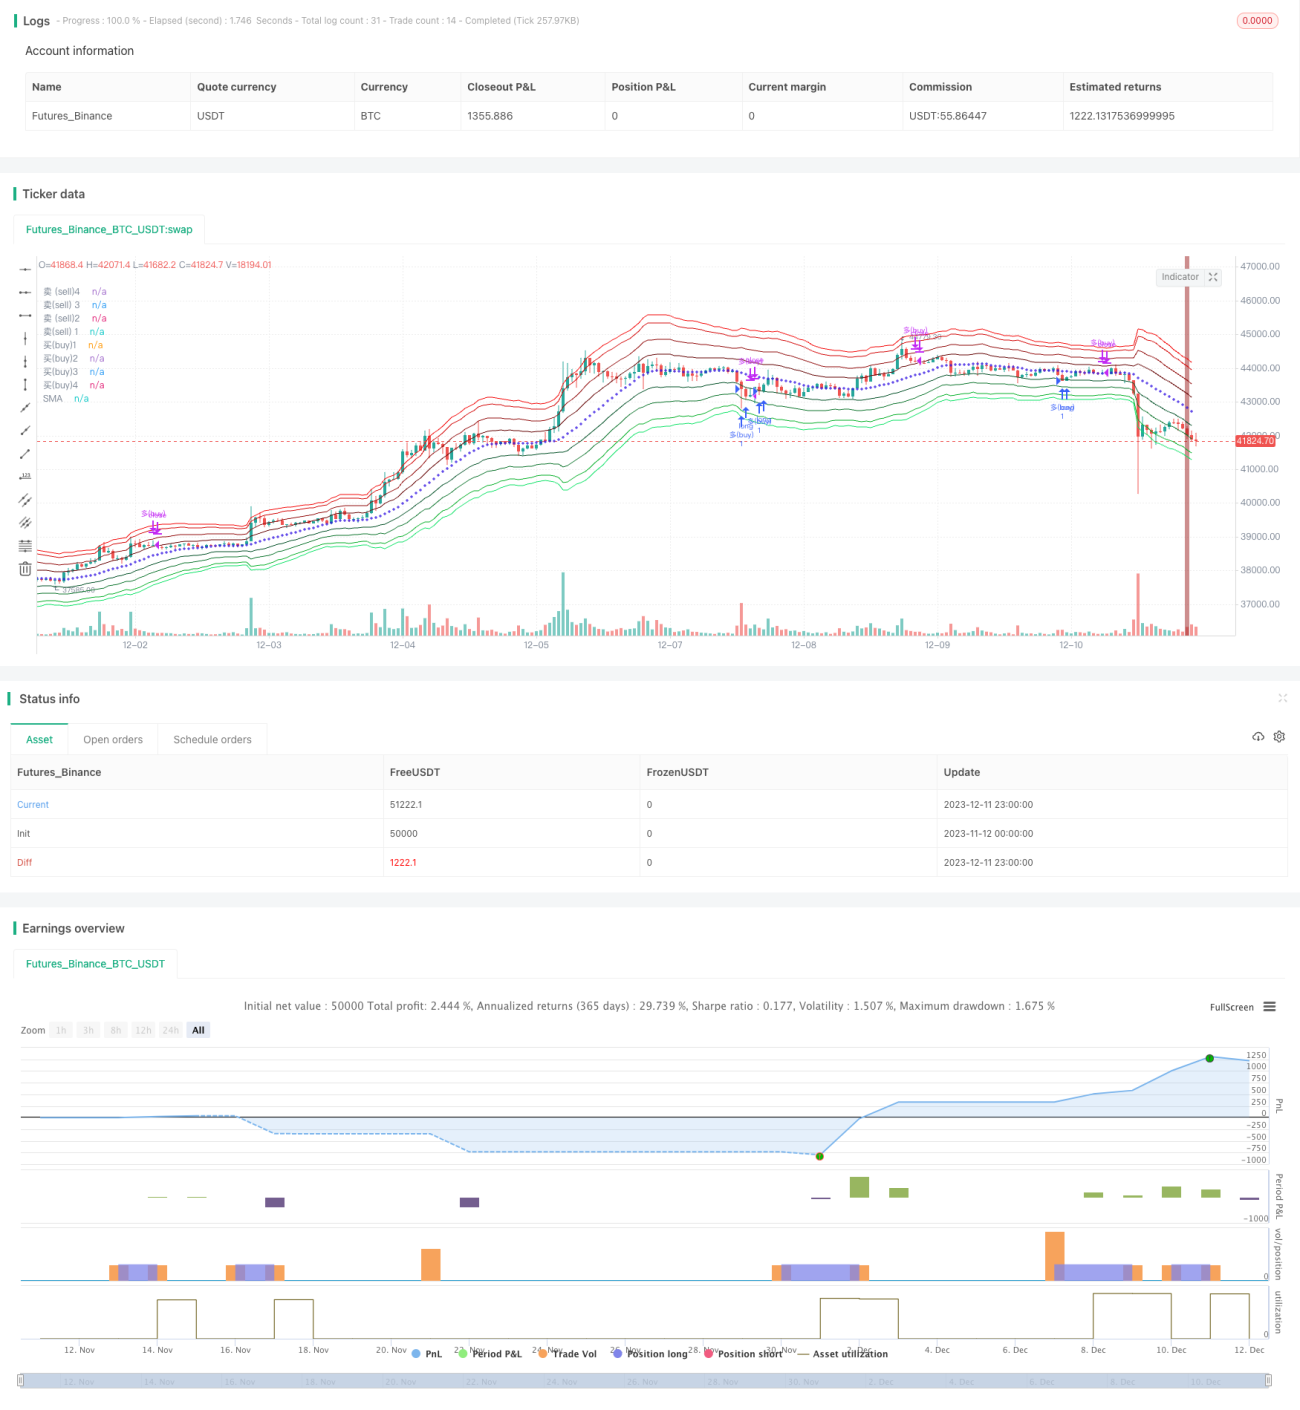
This strategy uses the Bollinger Bands indicator to draw price channels based on ATR and Fibonacci retracements as grids. Combining with double EMA lines to determine the overall trend direction, selectively set trailing stop-loss grids at Bollinger price bands in the trend direction to achieve trend tracking arbitrage.

Strategy Principle

  1. Use the middle line of the Bollinger Bands and the upper and lower rails constructed from the ATR and 4 Fibonacci retracement lines to build the price wave bands.

  2. The fast EMA line and the slow SMA line form a double moving average to determine the overall trend direction. The fast line breaking through the slow line is a bull market, and vice versa is a bear market.

  3. In a bull market, only go long, choose prices near the lower rail of Bollinger Bands to break through the bottom of channel to open long positions; in a bear market, only go short, choose prices near the upper rail of Bollinger Bands to break through the top of channel to open short positions.

  4. Set stop loss conditions: exit current directional positions when a large reversal bar appears.

Advantage Analysis

  1. Use double moving averages to determine mega-level trends to avoid counter-trend trading.

  2. The Bollinger ATR channel grid sets multiple opening prices to increase the probability of opening positions successfully.

  3. The Fibonacci retrace wave bands set price volatility, with different numbers of positions in different bands, achieving capital dispersion.

  4. Real-time stop loss conditions facilitate quick stop losses and reduce profit retracements.

Risk Analysis

  1. Errors in judging mega-level trends may lead to contrarian losses. Appropriately adjust the moving average parameters or add other indicators for auxiliary judgment.

  2. When volatility is too large, prices may break through the grid area directly, unable to open positions. Adjust the wave band parameters to increase trading opportunities.

  3. Stop loss conditions are more subjective, and recognition criteria may differ across traders. It is recommended to test and optimize stop loss conditions.

Optimization Directions

  1. Add APO indicator for auxiliary analysis of double moving average trend judgments.

  2. Use market volatility indicators to optimize Bollinger waveband parameters to better adapt to dynamic market changes.

  3. Reduce the stop loss amplitude and add OTHER way to set stop loss conditions to reduce errors.

Summary

The overall idea of this strategy is clear, combining Bollinger ATR channel and double moving averages to achieve comprehensive judgment of strategy trading signals, maximizing the risk reduction of misjudgment. The advantages of the strategy are obvious and can be applied in actual trading; but there is still room for optimization in details such as parameter settings and stop loss conditions, which need to be further improved. It is believed that with continuous optimization, the profitability and stability of this strategy will continue to increase.


/*backtest
start: 2023-11-12 00:00:00
end: 2023-12-12 00:00:00
period: 1h
basePeriod: 15m
exchanges: [{"eid":"Futures_Binance","currency":"BTC_USDT"}]
*/

// This source code is subject to the terms of the Mozilla Public License 2.0 at https://mozilla.org/MPL/2.0/
// © Aayonga

//@version=5
strategy("fib trend grid@Aa", overlay=true,initial_capital=2000, default_qty_type=strategy.fixed, default_qty_value=1)

//回测时间
useDateFilter=input.bool(true,title = "启用回测时间范围限定(backtest)", group = "回测范围(backtest)")
backtesStarDate=input(timestamp("1 Jan 2015"),title = "开始时间(Start)", group = "回测范围(backtest)")
backtestEndDate=input(timestamp("1 Jan 2040"),title = "结束时间(finish)",group = "回测范围(backtest)")
inTradeWindow=true


//入场位 entry
bolllen=input.int(defval=20,minval=1,title="布林长度,(boll length)",group = "入场位(entry)")
sma=ta.sma(close,bolllen)
avg=ta.atr(bolllen)
fib1=input(defval=1.236,title="Fib 1",group = "入场位(entry)")
fib2=input(defval=2.382,title="Fib 2",group = "入场位(entry)")
fib3=input(defval=3.618,title="fib 3",group = "入场位(entry)")
fib4=input(defval=4.236,title="Fib 4",group = "入场位(entry)")
r1=avg*fib1
r2=avg*fib2
r3=avg*fib3
r4=avg*fib4
top4=sma+r4
top3=sma+r3
top2=sma+r2
top1=sma+r1
bott1=sma-r1
bott2=sma-r2
bott3=sma-r3
bott4=sma-r4


//趋势 trend

t4=plot(top4,title="卖 (sell)4",color=color.rgb(244, 9, 9))
t3=plot(top3,title = "卖(sell) 3",color=color.rgb(211, 8, 8))
t2=plot(top2,title="卖 (sell)2",color=color.rgb(146, 13, 13))
t1=plot(top1,title="卖(sell) 1",color=color.rgb(100, 3, 3))

b1=plot(bott1,title="买(buy)1",color=color.rgb(4, 81, 40))
b2=plot(bott2,title="买(buy)2",color=color.rgb(15, 117, 46))
b3=plot(bott3,title = "买(buy)3",color =color.rgb(8, 176, 42) )
b4=plot(bott4,title="买(buy)4",color=color.rgb(15, 226, 103))
plot(sma,style=plot.style_cross,title="SMA",color=color.rgb(47, 16, 225))

//趋势
LengthF=input(defval = 25,title = "快线长度(fastlength)")
LengthS=input(defval=200,title = "慢线长度(slowlength)")
emaF=ta.ema(close,LengthF)
smaS=ta.sma(close,LengthS)
longTrend=emaF>smaS
longb=ta.crossover(emaF,smaS)
bgcolor(longb ? color.new(color.green,40):na,title = "多头强势(bull trend)")
shortTrend=smaS>emaF
shortb=ta.crossunder(emaF,smaS)
bgcolor(shortb ? color.new(#951313, 40):na,title = "空头强势(bear trend)")

//pinbar
bullPinBar = ((close > open) and ((open - low) > 0.6* (high - low))) or ((close < open) and ((close - low) > 0.9 * (high - low)))
//plotshape(bullPinBar  , text ="pinbar", textcolor=color.rgb(9, 168, 144),location=location.belowbar, color=color.rgb(29, 103, 67), size=size.tiny)
bearPinBar = ((close > open) and ((high - close) > 0.7 * (high - low))) or ((close < open) and ((high - open) > 0.7 * (high - low)))
//plotshape(bearPinBar  , text ="pinbar", textcolor=color.rgb(219, 12, 12),location=location.abovebar, color=color.rgb(146, 7, 7), size=size.tiny)

buy1=ta.crossunder(close,bott1) and longTrend and close>ta.ema(close,100)
buy2=ta.crossunder(close,bott2) and longTrend and close>ta.ema(close,80)
buy3=ta.crossunder(close,bott3) and longTrend and close>ta.ema(close,80)
buy4=ta.crossunder(close,bott4) and longTrend and close>ta.ema(close,80)
buyclose=bearPinBar or ta.crossunder(close,smaS)


if buy2 or buy3 or buy4 or buy1 and inTradeWindow
    strategy.order("多(buy)",strategy.long)

if buyclose  and inTradeWindow
    strategy.close("多(buy)")

sell1=ta.crossover(close,top1) and shortTrend and close<ta.ema(close,200)
sell2=ta.crossover(close,top2) and shortTrend and close<ta.ema(close,200)
sell3=ta.crossover(close,top3) and shortTrend and close<ta.ema(close,200)
sell4=ta.crossover(close,top4) and shortTrend and close<ta.ema(close,200)
sellclose=bullPinBar or ta.crossover(close,ta.sma(close,220))

if  sell1 or sell2 or sell3 or sell4 and inTradeWindow
    strategy.order("空(sell)",strategy.short)

if sellclose  and inTradeWindow
    strategy.close("空(sell)")
     

More