Kaufman's Adaptive Moving Average Trend Tracking Strategy

Overview
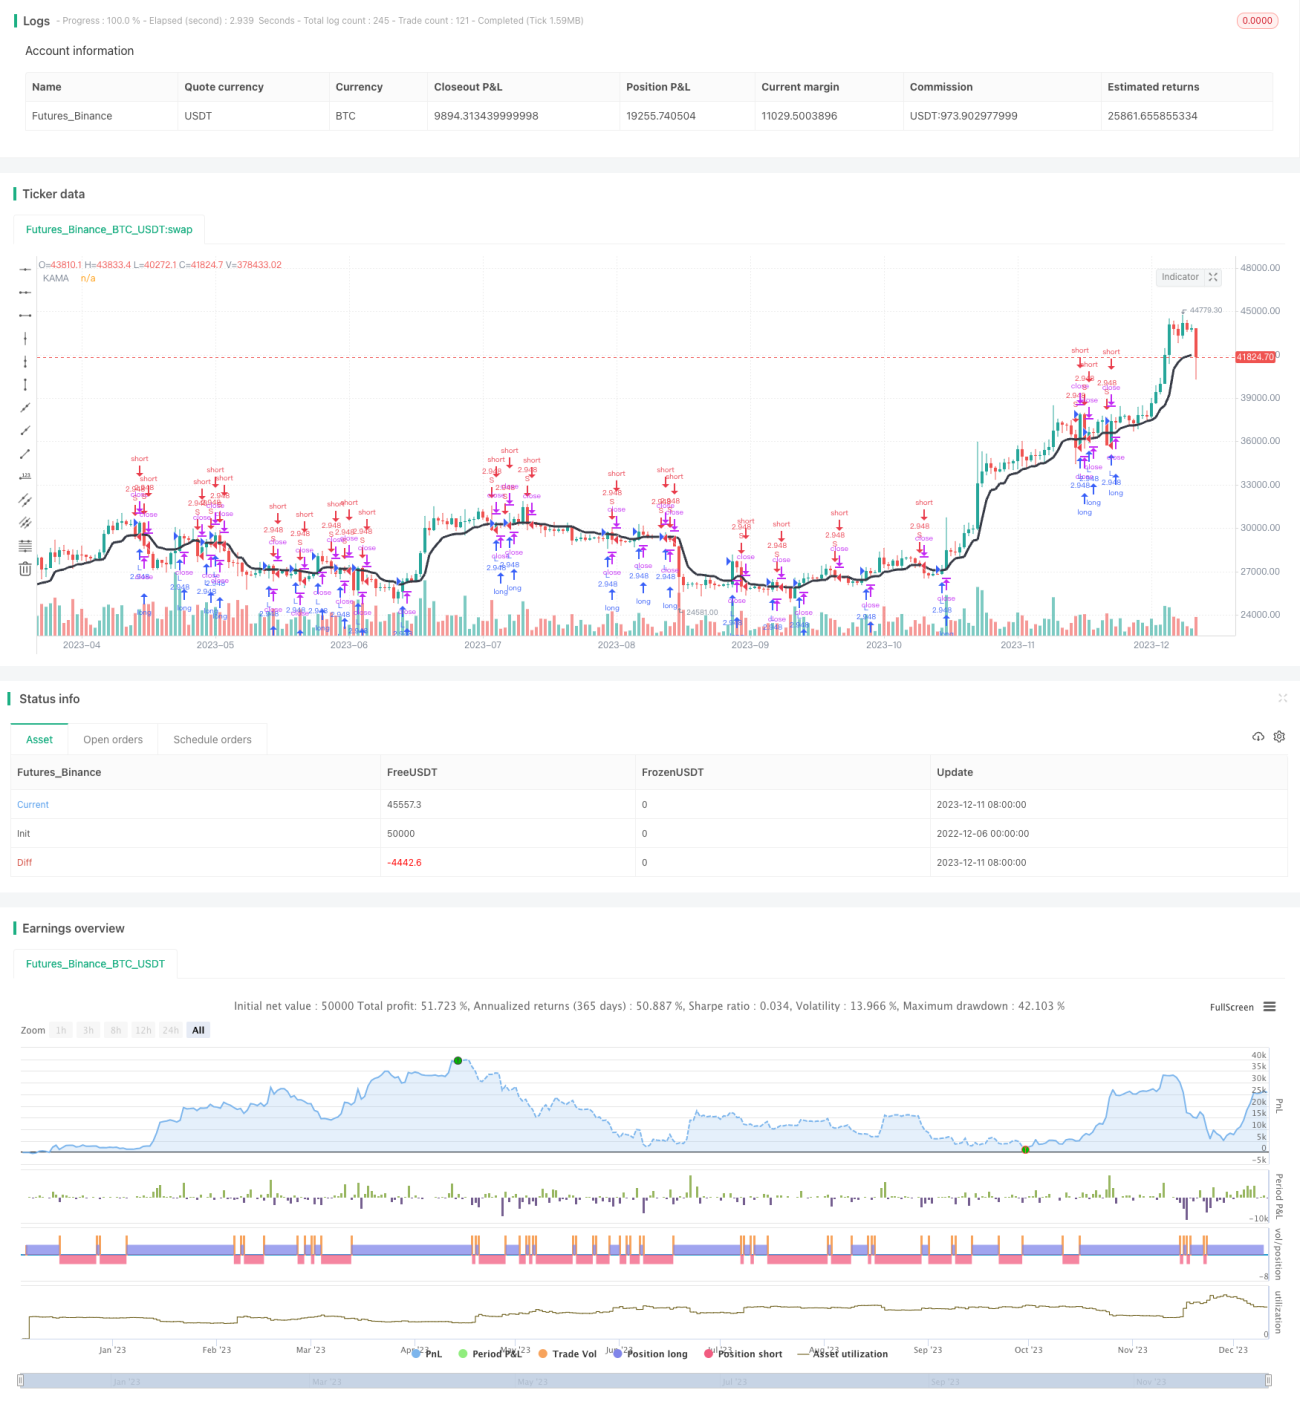
This strategy uses Kaufman's Adaptive Moving Average (KAMA) to determine the trend direction for catching medium-to-long term trends. It goes long when the KAMA line moves up and goes short when the KAMA line moves down. The strategy combines the trend tracking capability of moving averages and the dynamic adjustment feature of KAMA to improve the quality of trading signals.
Strategy Logic
The core indicator of this strategy is Kaufman's Adaptive Moving Average (KAMA). KAMA dynamically adjusts its weighting factor based on the magnitude of market volatility, thereby improving the sensitivity of the curve. Specifically, when market volatility increases, the KAMA curve becomes smoother; when market volatility decreases, the KAMA curve becomes more sensitive. This filters out some noise while still capturing new trend reversals in a timely manner.
The strategy first calculates the value of KAMA. Then it determines the long/short state of the KAMA line: a buy signal is generated when the close price crosses above the KAMA line, and a sell signal is generated when the close price crosses below the KAMA line. Positions are opened based on these trading signals.
Advantage Analysis
The biggest advantage of this strategy is the use of the KAMA indicator for trend determination. The KAMA indicator itself has very strong trend tracking capability. It can dynamically adjust parameters to adapt to market conditions, thereby producing more reliable trading signals compared to simple moving averages and exponential moving averages.
In addition, the strategy only uses the long/short state of KAMA to determine the trend direction. There are no additional filters, which simplifies the strategy logic and reduces the number of parameters, lowering the risk of overfitting and improving stability and adaptability across markets.
Risk Analysis
The main risk of this strategy is that KAMA is a lagging indicator, so the market trend may have already reversed by the time the trading signals are generated, leading to stop loss risks. In addition, there can be short-term oscillations in the KAMA curve, which may produce some frequent false signals.
To mitigate risks, other indicators may be combined to confirm trading signals, such as volatility indicators, volume indicators, etc. The parameters can also be adjusted to make the KAMA curve smoother.
Optimization Directions
There is still large room for optimizing this strategy, mainly in the following aspects:
-
Combine other indicators for signal filtering, such as MACD, oscillators etc, to improve signal quality.
-
Add stop loss strategies like moving stop loss or equity curve based stops to control single trade loss.
-
Optimize parameters to make KAMA more effective at catching trends.
-
Add multi-timeframe analysis to determine major trend direction using higher timeframes.
-
Use machine learning methods to auto optimize parameters for adapting across instruments.
Conclusion
The overall logic of this strategy is clear, using KAMA indicator to determine trend direction. It has advantages like strong trend tracking capability, simple logic and fewer parameters. But it also has the risk of lagging in identifying trend reversals. The strategy can be improved in many ways to make it more effective and adaptable.
- 1