Double Bollinger Bands Breakout Strategy

Author: ChaoZhang, Date: 2023-12-13 17:33:24
Tags:

img

Overview

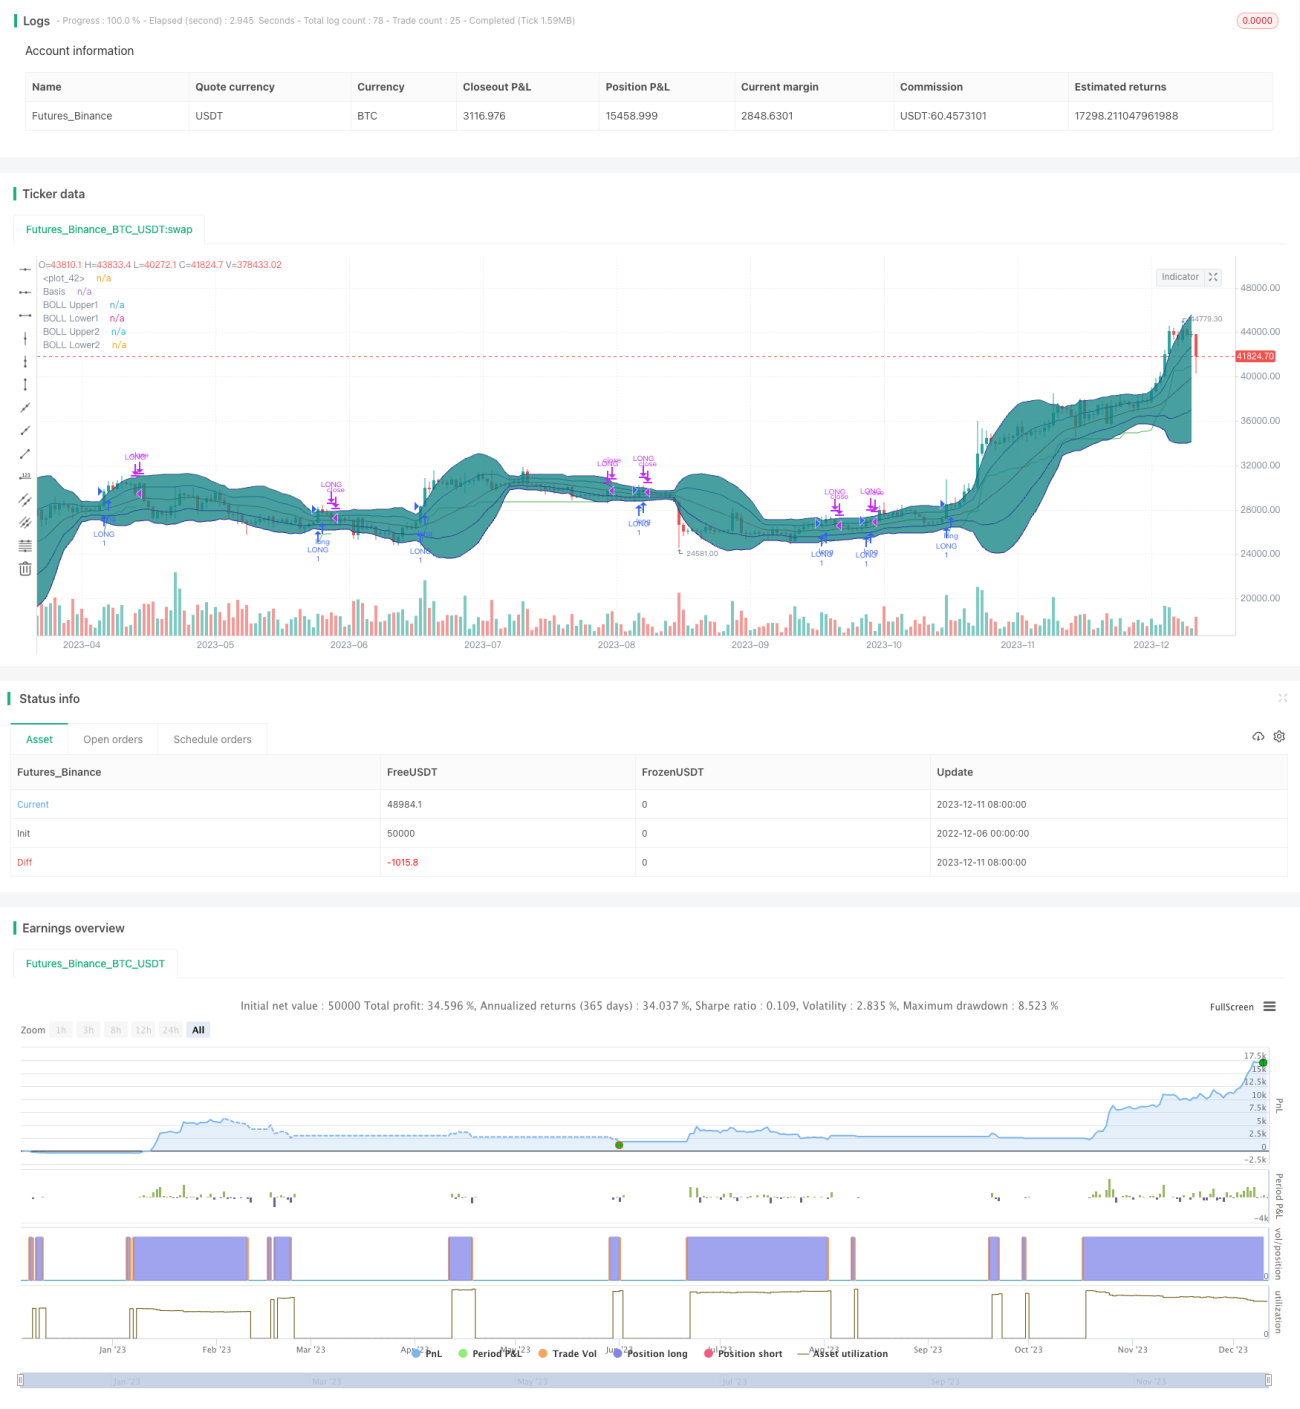
This strategy uses double Bollinger Bands to identify consolidation zones and breakout signals to implement low-buy-high-sell trading strategy. When price breaks through the neutral zone, it signals the start of a new trend and time to enter long position. When price breaks back below the neutral zone, it signals the end of the trend and time to close position.

Strategy Logic

The strategy employs two Bollinger Bands. The inner BB has upper/lower bands of 20SMA ± 1 standard deviation. The outer BB has upper/lower bands of 20SMA ± 2 standard deviations. The area between the two BBs is defined as the neutral zone.

When price stays inside the neutral zone for two consecutive candles, it is considered consolidation. When price closes above the upper band of the inner BB after two consecutive neutral zone candles, a long signal is generated.

After entering long, stop loss is set at lowest price - 2xATR to lock in profit and control risk. Position is closed when price breaks back below the upper band of the inner BB.

Advantage Analysis

This strategy combines indicators and trend to identify consolidation zones and determine trend start, allowing low-buy-high-sell trading with large profit potential. The stop loss strategy locks in profit and enhances stability.

Risk Analysis

The strategy relies on breakout signals which can turn out to be false breakouts, resulting in losing trades. Also, stops being too tight may risk premature liquidation.

Solutions include optimizing BB parameters, adding filters to reduce false signals, and allowing wider stops.

Optimization Directions

  1. Optimize BB parameters to reduce false breakouts
  2. Add other filters e.g. volume to avoid low-volume false breaks
  3. Adjust stop loss strategy to prevent whipsaws and early stops
  4. Scale in positions to reduce single-trade risks

Conclusion

This strategy integrates double BBs and trend strategies for low-buy-high-sell trading with large profit potential. The stop loss strategy also enhances stability. Further optimizations can improve strategy performance for live trading.


/*backtest
start: 2022-12-06 00:00:00
end: 2023-12-12 00:00:00
period: 1d
basePeriod: 1h
exchanges: [{"eid":"Futures_Binance","currency":"BTC_USDT"}]
*/

// This source code is subject to the terms of the Mozilla Public License 2.0 at https://mozilla.org/MPL/2.0/
// © DojiEmoji

//@version=4
strategy("[KL] Double BB Strategy",overlay=true,pyramiding=1)
ENUM_LONG = "LONG"

// Timeframe {
backtest_timeframe_start = input(defval = timestamp("01 Apr 2020 13:30 +0000"), title = "Backtest Start Time", type = input.time)
USE_ENDTIME = input(false,title="Define backtest end-time (If false, will test up to most recent candle)")
backtest_timeframe_end = input(defval = timestamp("19 Apr 2021 19:30 +0000"), title = "Backtest End Time (if checked above)", type = input.time)
within_timeframe = true
// }

// Bollinger bands
BOLL_length = 20, BOLL_src = close, SMA20 = sma(BOLL_src, BOLL_length)
BOLL_sDEV = stdev(BOLL_src, BOLL_length)
BOLL_upper1 = SMA20 + BOLL_sDEV, BOLL_lower1 = SMA20 - BOLL_sDEV
BOLL_upper2 = SMA20 + BOLL_sDEV*2, BOLL_lower2 = SMA20 - BOLL_sDEV*2
SMA_20_plot = plot(SMA20, "Basis", color=#872323, offset = 0)
BOLL_upper1_plot = plot(BOLL_upper1, "BOLL Upper1", color=color.navy, offset = 0, transp=50)
BOLL_lower1_plot = plot(BOLL_lower1, "BOLL Lower1", color=color.navy, offset = 0, transp=50)
BOLL_upper2_plot = plot(BOLL_upper2, "BOLL Upper2", color=color.navy, offset = 0, transp=50)
BOLL_lower2_plot = plot(BOLL_lower2, "BOLL Lower2", color=color.navy, offset = 0, transp=50)
fill(BOLL_upper2_plot, BOLL_upper1_plot, title = "Background", color=#198787, transp=85)
fill(BOLL_upper1_plot, SMA_20_plot, title = "Background", color=#198787, transp=75)
fill(SMA_20_plot, BOLL_lower1_plot, title = "Background", color=#198787, transp=75)
fill(BOLL_lower1_plot, BOLL_lower2_plot, title = "Background", color=#198787, transp=85)


// Trailing stop loss {
ATR_X2_TSL = atr(input(14,title="Length of ATR for trailing stop loss")) * input(2.0,title="ATR Multiplier for trailing stop loss",type=input.float)
TSL_source = low
var stop_loss_price = float(0)
TSL_line_color = color.green, TSL_transp = 100
if strategy.position_size == 0 or not within_timeframe
    TSL_line_color := color.black
    stop_loss_price := TSL_source - ATR_X2_TSL 
else if strategy.position_size > 0
    stop_loss_price := max(stop_loss_price, TSL_source - ATR_X2_TSL)
    TSL_transp := 0
plot(stop_loss_price, color=color.new(TSL_line_color, TSL_transp))
// }

// Signals for entry
is_neutral = close < BOLL_upper1 and close > BOLL_lower2
is_consol = is_neutral and is_neutral[2]
entry_signal = is_consol[1] and close > BOLL_upper1


// MAIN:
if within_timeframe
    // EXIT ::::::::::::::::::::::::::::::::::::::::::::::::::::::::::::::::::::
	exit_msg = close <= strategy.position_avg_price ? "stop loss" : "take profit"
	end_of_rally = close < BOLL_upper1 and strategy.position_avg_price > stop_loss_price	// also detects false breakouts
	if strategy.position_size > 0 and (TSL_source <= stop_loss_price or end_of_rally)
        strategy.close(ENUM_LONG, comment=exit_msg)

    // ENTRY :::::::::::::::::::::::::::::::::::::::::::::::::::::::::::::::::::
    if (strategy.position_size == 0 or (strategy.position_size > 0 and close > stop_loss_price)) and entry_signal
		entry_msg = strategy.position_size > 0 ? "adding" : "initial"
		strategy.entry(ENUM_LONG, strategy.long, comment=entry_msg)

// CLEAN UP:
if strategy.position_size == 0
	stop_loss_price := float(0)

More