WAMI Strategy

Overview
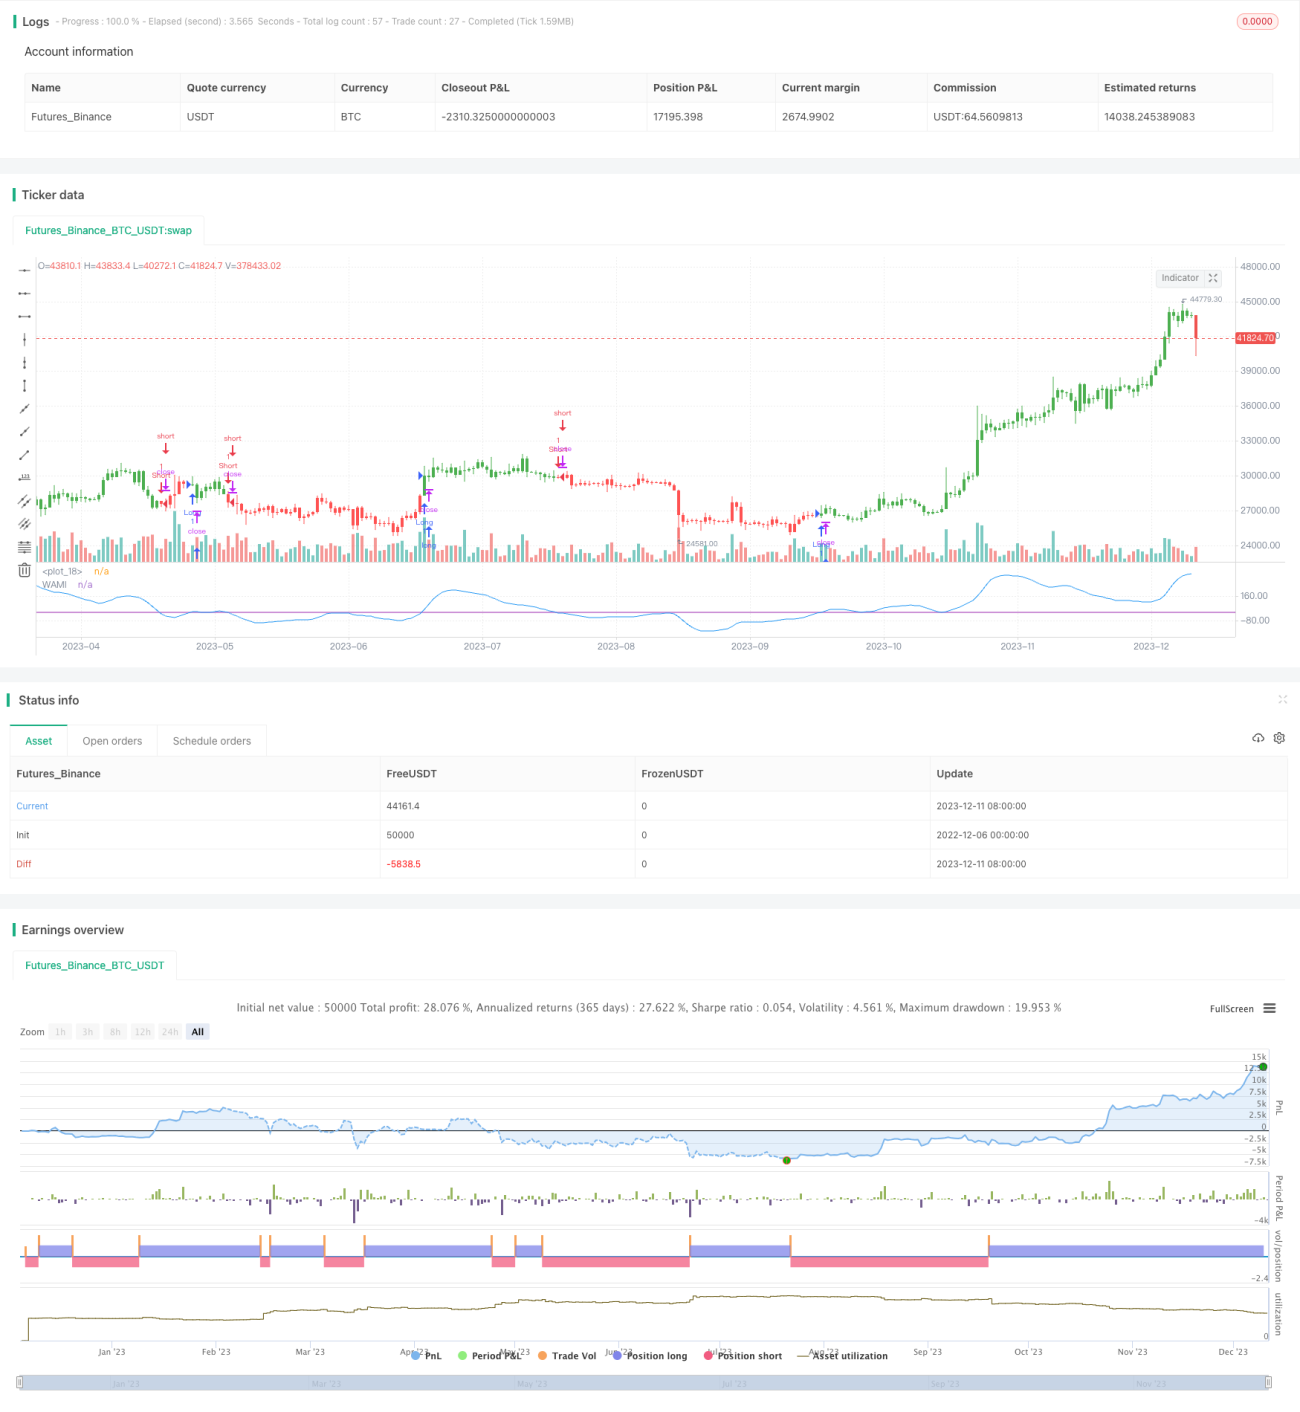
The WAMI Strategy is a trading strategy based on Fourier analysis that aims to find consistent and profitable trades on historical market data through an iterative optimization process. It combines the Exponential Moving Average (EMA), Weighted Moving Average (WMA), and Momentum indicator (MOM) to form a composite trading indicator called WAMI. When the WAMI crosses above or below a threshold, the strategy will issue buy or sell signals.
Strategy Logic
The core indicator of this strategy is WAMI. Its calculation is: first compute the momentum of price, then take the n-day WMA, and finally perform EMA twice to derive the final WAMI. Among them, momentum reflects the speed of price changes, WMA filters out short-term noise, and EMA smoothes the price.
When WAMI rises above a given threshold, a buy signal is generated, implying an uptrend is forming in the market. When it falls below the threshold, a sell signal is generated, meaning a downtrend has commenced. Users can adjust the threshold based on backtest results to better optimize the strategy.
Advantage Analysis
This strategy combines trend-following and overbought-oversold analysis, which can capture medium-to-long term price trends while avoiding being trapped. Compared to plain moving average strategies, WAMI improves the quality and consistency of trading signals.
The main advantages are:
- Fourier optimization improves parameter tuning
- Double EMA filter reduces false signals
- WMA+MOM combo improves sensitivity
- Flexible for both short and long-term trading
Risk Analysis
There are also some risks with this strategy:
- Optimization process is complex, improper settings may fail
- Performance decreases in ranging markets
- Performance highly depends on parameter settings
- Slow to switch on trend reversals
These risks can be reduced by adjusting parameter combinations, setting stop loss, and having reasonable profit expectations. The strategy should be stopped or position sized down when markets become excessively volatile.
Optimization Directions
Some aspects this strategy can be further optimized on:
- Test more parameter sets to find optimum
- Add supporting conditions like volume filter for entries
- Incorporate stop loss mechanisms
- Combine with other indicators to gauge overall trend
- Dynamically adjust parameters to fit changing market environments
Conclusion
In conclusion, the WAMI Strategy is a recommended medium-to-long term trend following strategy. By thoroughly analyzing price and volume changes, it generates quality trading signals. Given proper parameter optimization and risk control, this strategy can achieve steady profits. However, users should note that any strategy may fail, so prudent evaluation is a must before committing real capital.
/*backtest
start: 2022-12-06 00:00:00
end: 2023-12-12 00:00:00
period: 1d
basePeriod: 1h
exchanges: [{"eid":"Futures_Binance","currency":"BTC_USDT"}]
*/

//@version=2
////////////////////////////////////////////////////////////
//  Copyright by HPotter v1.0 17/01/2017
// The WAMI-based trading lies in the application and iteration of the - 1