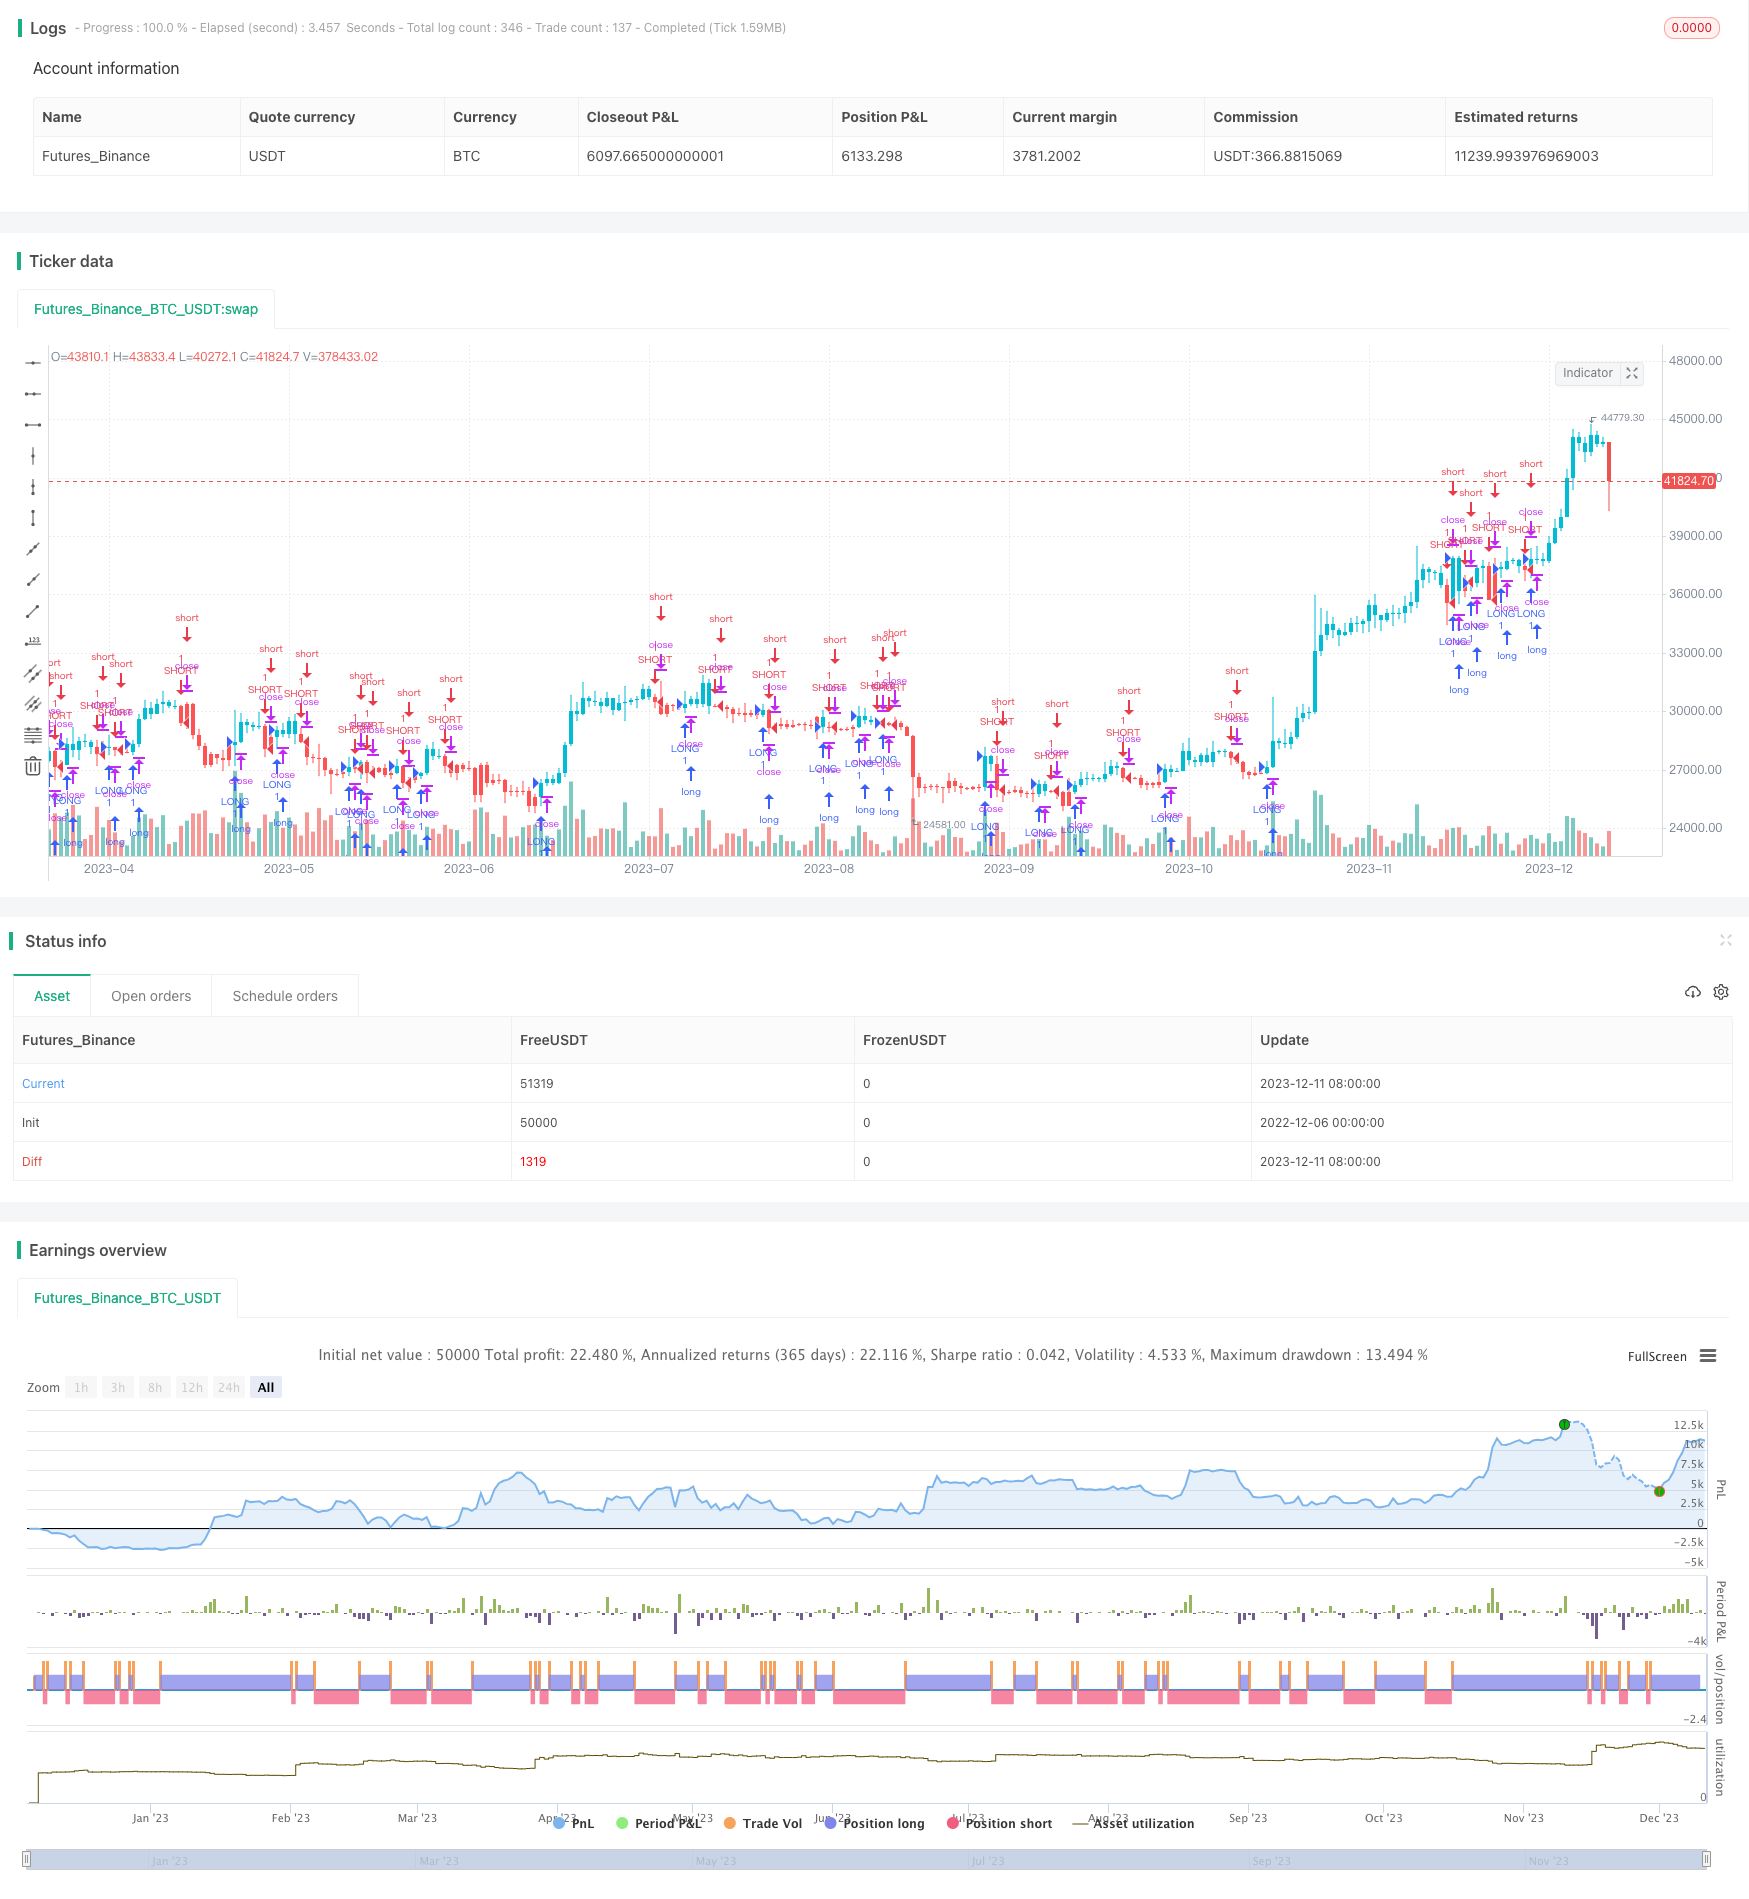
Heiken Ashi Crossover Strategy

Author: ChaoZhang, Date: 2023-12-13 17:46:10
Tags:

img

Overview

The Heiken Ashi Crossover Strategy is a quantitative trading strategy that applies both the Heiken Ashi crossover principle and smoothing techniques. By calculating the average price over 4 periods to generate the smoothed price, and then computing the Heiken Ashi crossover based on the smoothed prices, it can issue reliable trading signals. Compared with the original Heiken Ashi crossover, this strategy can filter out short-term market noise and avoid wrong signals by using smoothing techniques.

Strategy Logic

The core logic behind this strategy includes:

  1. Heiken Ashi Crossover Principle

    Heiken Ashi crossover refers to the buy or sell signals generated when the short-term moving average crosses over or below the long-term moving average. In this strategy, the short-term MA is the smoothed closing price (haclose), while the long-term MA is the smoothed opening price (haopen).

  2. Smoothing Techniques

    To filter out noise, this strategy adopts the average price over 4 periods to calculate the smoothed price:

    haclose = (open + high + low + close) / 4

    haopen = (previous haopen + current haclose) / 2

The Heiken Ashi crossover signals based on the smoothed prices above can provide more reliable trading signals. A buy signal is generated when haclose crosses over haopen, while a sell signal is triggered when haclose crosses below haopen.

Advantage Analysis

Compared with the original Heiken Ashi crossover strategy, the Smoothed Heiken Ashi Crossover Strategy has the following edges:

  1. The smoothing techniques filter out short-term market noises and avoid wrong signals, thus improving the quality of trading signals.

  2. By adopting the 4-period average price to calculate the smoothed price, it can better reflect the medium-to-long term trend and generate more reliable trading signals.

  3. Combined with the fast-crossover feature of Heiken Ashi, this strategy can timely capture the turning points of medium-to-long term trends.

Risk Analysis

There are also some risks associated with this strategy:

  1. In periods of violent market fluctuation, the smoothing techniques may filter out some effective signals, thus missing potential trading opportunities.

  2. The 4-period moving average calculation also introduces a certain degree of lag, which may result in missing short-term opportunities.

  3. This strategy has some requirements on trading frequency and holding period. It is not suitable for overly frequent or long-term trading.

To tackle the risks above, parameters tuning of the smoothing techniques and incorporating other technical indicators can be helpful solutions.

Optimization Directions

This strategy can be optimized in the following aspects:

  1. Parameter tuning for the smoothing techniques, like adjusting the moving average period, to find the optimal parameter combination.

  2. Incorporating other indicators like volume, Bollinger Bands etc. to improve the accuracy of trading signals.

  3. Adding stop loss strategies like trailing stop loss, pyramiding stop loss to control risks.

  4. Optimizing money management by setting proper position sizing and stop loss levels to limit the loss of single trades.

Conclusion

The Heiken Ashi Crossover Strategy combines the Heiken Ashi crossover principle and smoothing techniques, which can effectively detect trend turning points in the medium-to-long term without being interfered by short-term market noises. Compared with the original Heiken Ashi crossover, this strategy filters out some noise by smoothing techniques and thus can generate higher quality trading signals. With proper stop loss and money management, this strategy can earn relatively steady returns from the market. However, traders should also be aware of the risks like lag and missing signals, and optimize the strategy accordingly.


/*backtest
start: 2022-12-06 00:00:00
end: 2023-12-12 00:00:00
period: 1d
basePeriod: 1h
exchanges: [{"eid":"Futures_Binance","currency":"BTC_USDT"}]
*/

//@version=2
strategy("Heikin-Ashi Strategy", overlay=true)

// Plots Color Of Heikin-Ashi Bars while Viewing Candlestics or Bars
//Works on Candlesticks and OHLC Bars - Does now work on Heikin-Ashi bars - But I have verified its accuracy
// Created By User ChrisMoody 1-30-2014 with help from Alex in Tech Support

// === BACKTEST RANGE ===
FromMonth = input(defval = 1, title = "From Month", minval = 1)
FromDay   = input(defval = 1, title = "From Day", minval = 1)
FromYear  = input(defval = 2017, title = "From Year", minval = 1998)
ToMonth   = input(defval = 1, title = "To Month", minval = 1)
ToDay     = input(defval = 1, title = "To Day", minval = 1)
ToYear    = input(defval = 9999, title = "To Year", minval = 1998)


haclose = ((open + high + low + close)/4)//[smoothing]
haopen = na(haopen[1]) ? (open + close)/2 : (haopen[1] + haclose[1]) / 2

heikUpColor() => haclose > haopen
heikDownColor() => haclose <= haopen

barcolor(heikUpColor() ? aqua: heikDownColor() ? red : na)


if (heikUpColor() )
    strategy.entry("LONG", strategy.long, comment="LONG")
    
if (heikDownColor())
    strategy.entry("SHORT", strategy.short, comment="SHORT")


//plot(pos, title="pos", style=line, linewidth=1, color=red )

More