RSI and Moving Average Crossover Trend Following Strategy

Overview
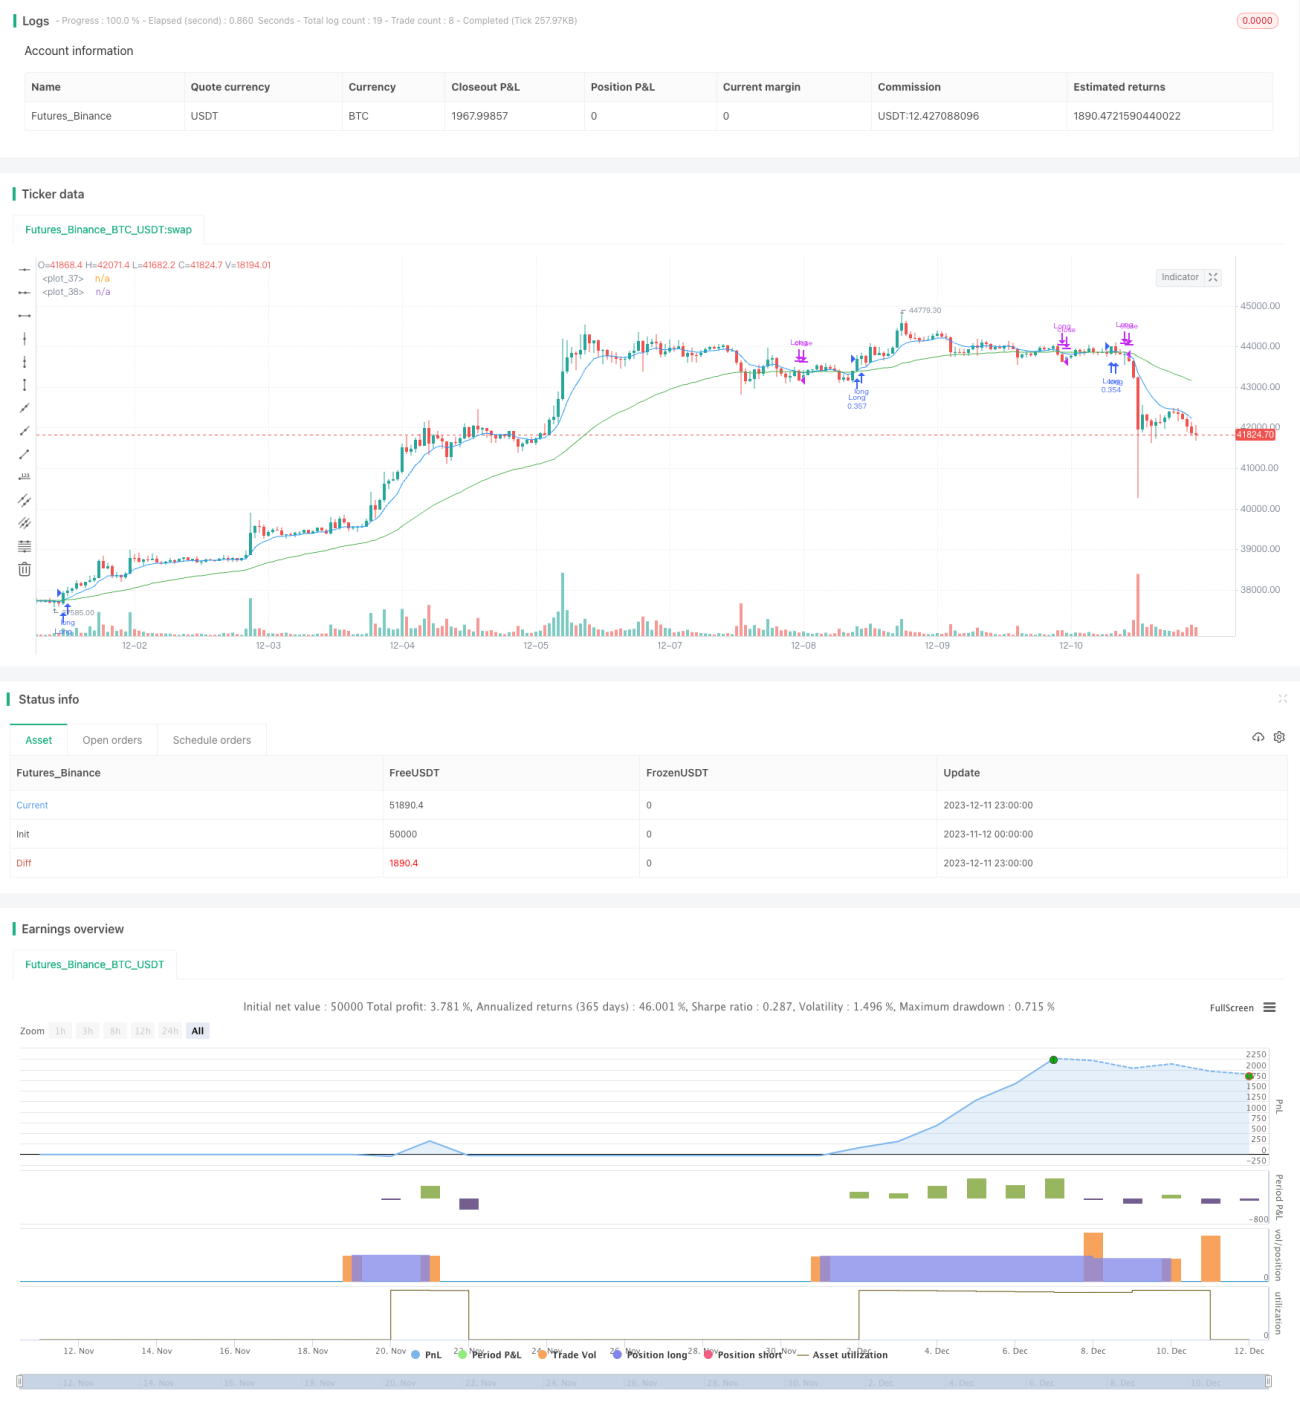
This strategy utilizes the RSI indicator and fast/slow moving averages to determine entry and exit points. It goes long when RSI rises 5 points and is below 70; and when the 9-day MA crosses above the 50-day MA. It exits when the 50-day MA crosses below the 9-day MA.
Strategy Logic
The strategy mainly employs a combination of the RSI indicator and moving averages. The RSI indicator shows whether a stock or cryptocurrency is overbought or oversold. Values below 30 are considered oversold while values above 70 are considered overbought. This strategy uses RSI to determine appropriate entry points outside of these extreme areas.
Moving averages are widely used to identify trend direction. The fast moving average reacts more quickly to price changes while the slow MA filters out false breakouts. When the fast MA crosses above the slow MA, an uptrend begins. The opposite signals a downtrend. This strategy uses the 9 and 50-day MAs and their crosses to determine the trend and entries/exits.
Advantage Analysis
The biggest advantage of this strategy is using RSI to avoid buying at extreme overbought levels and using the fast/slow MAs combo to filter out false breakouts and lock in the trend direction for higher profitability.
The additional condition of 5 consecutive RSI point increase prevents unnecessary buys in overbought zones. Also, the partial position sizing greatly reduces loss risks per trade.
Risks and Prevention
The biggest risk is lagging signals from RSI and MAs during violent price swings, causing buys at tops or sells at bottoms.
To prevent this, a faster MA is used to catch price changes more rapidly and reduce lag. Also, partial sizing reduces loss per trade.
Optimization Directions
Possible optimization paths:
-
Test RSI periods for optimal parameters
-
Test more fast/slow MA combinations for better filtering
-
Optimize position sizing with different parameters
-
Add stop loss conditions to lock profits
Conclusion
Overall this strategy is well-suited for trend trading. It avoids overbought/oversold areas with RSI and uses fast/slow MAs for trend and support/resistance detection. Partial sizing allows for high win rates and profitability. Further parameter optimization and risk management can enhance performance.
- 1