Dual Reversal Trend Tracking Strategy

Overview
This is a trend tracking strategy that combines dual reversal signals. It integrates the 123 reversal strategy and performance index strategy to track price reversal points for more reliable trend judgment.
Strategy Principle
The strategy consists of two sub-strategies:
-
123 Reversal Strategy
Use 14-day K-line to judge reversal signals. The specific rules are:
- Bullish signal: The closing price fell in the previous two days. The current K-line closing price is higher than the previous day's closing price. 9-day Stochastic Slow is lower than 50
- Bearish signal: The closing price rose in the previous two days. The current K-line closing price is lower than the previous day's closing price. 9-day Stochastic Fast is higher than 50
-
Performance Index Strategy
Calculate the increase/decrease percentage over the past 14 days as an indicator. The rules are:
- Performance index > (0), generate bullish signal
-Performance index <(0), generate bearish signal
- Performance index > (0), generate bullish signal
The final signal is a combination of both signals. That is, same direction bullish/bearish signals are required to generate actual buy/sell operations.
This can filter out some noise and make the signals more reliable.
Advantages of the Strategy
This dual reversal system has the following advantages:
- More reliable signals by combining dual factors
- Can effectively filter market noise and avoid false signals
- 123 pattern is classic and practical, easy to judge and reproduce
- Performance index can judge future trend direction
- Flexible parameter combination, can be further optimized
Risks of the Strategy
The strategy also has some risks:
- May miss sudden reversals, cannot fully capture trends
- Dual signal combinations lead to fewer signals, which may affect profitability
- Requires consistent judgment, easily affected by individual stock fluctuations
- Parameter setting problems may lead to signal deviations
Following aspects can be considered for optimization:
- Adjust parameters like K-line length, Stochastic cycle etc.
- Optimize the logic for dual signal judgment
- Incorporate more factors like volume etc.
- Add stop loss mechanism
Summary
The strategy integrates dual reversal judgments to effectively discover price inflection points. Although the probability of signal occurrence decreases, the reliability is higher, suitable for capturing medium and long term trends. The strategy effect can be further enhanced through parameter adjustment and multi-factor optimization.
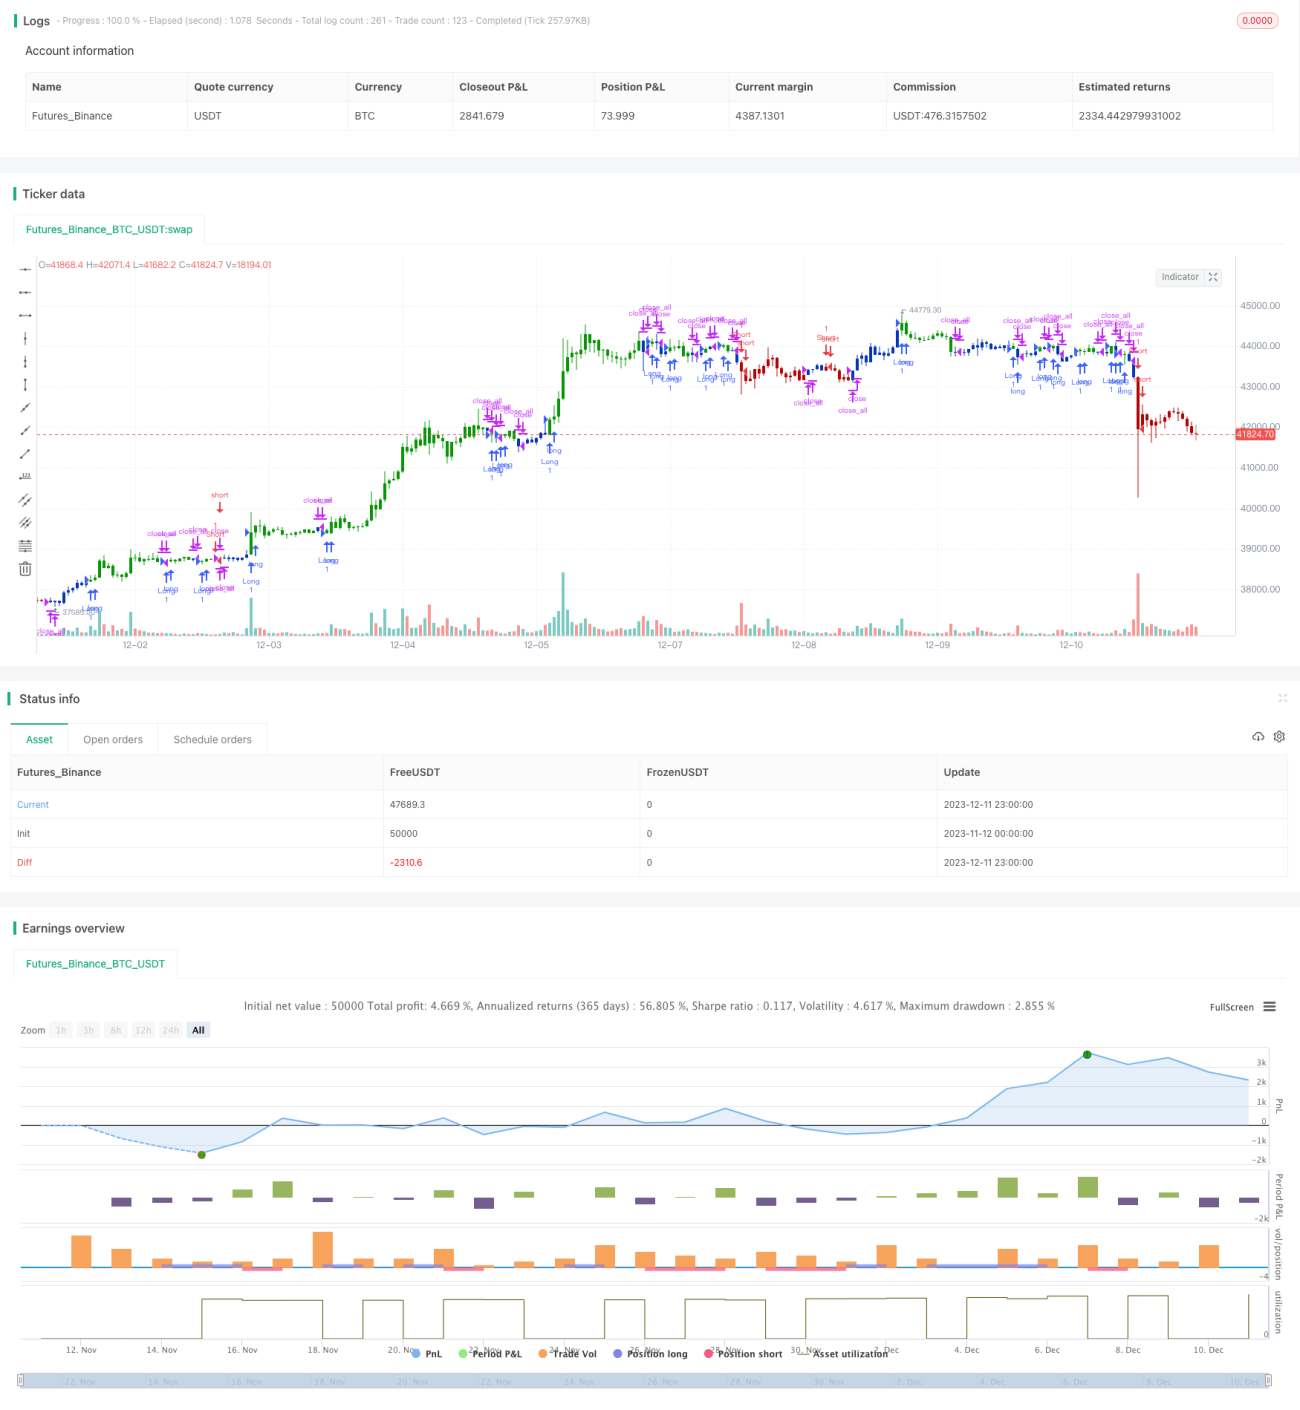
/*backtest
start: 2023-11-12 00:00:00
end: 2023-12-12 00:00:00
period: 1h
basePeriod: 15m
exchanges: [{"eid":"Futures_Binance","currency":"BTC_USDT"}]
*/

//@version=4
////////////////////////////////////////////////////////////
//  Copyright by HPotter v1.0 15/04/2021
// This is combo strategies for get a cumulative signal. - 1