Linear MACD Unlocking the Magic of Linear Regression in TradingView

Strategy Name: Momentum-driven Linear MACD Strategy
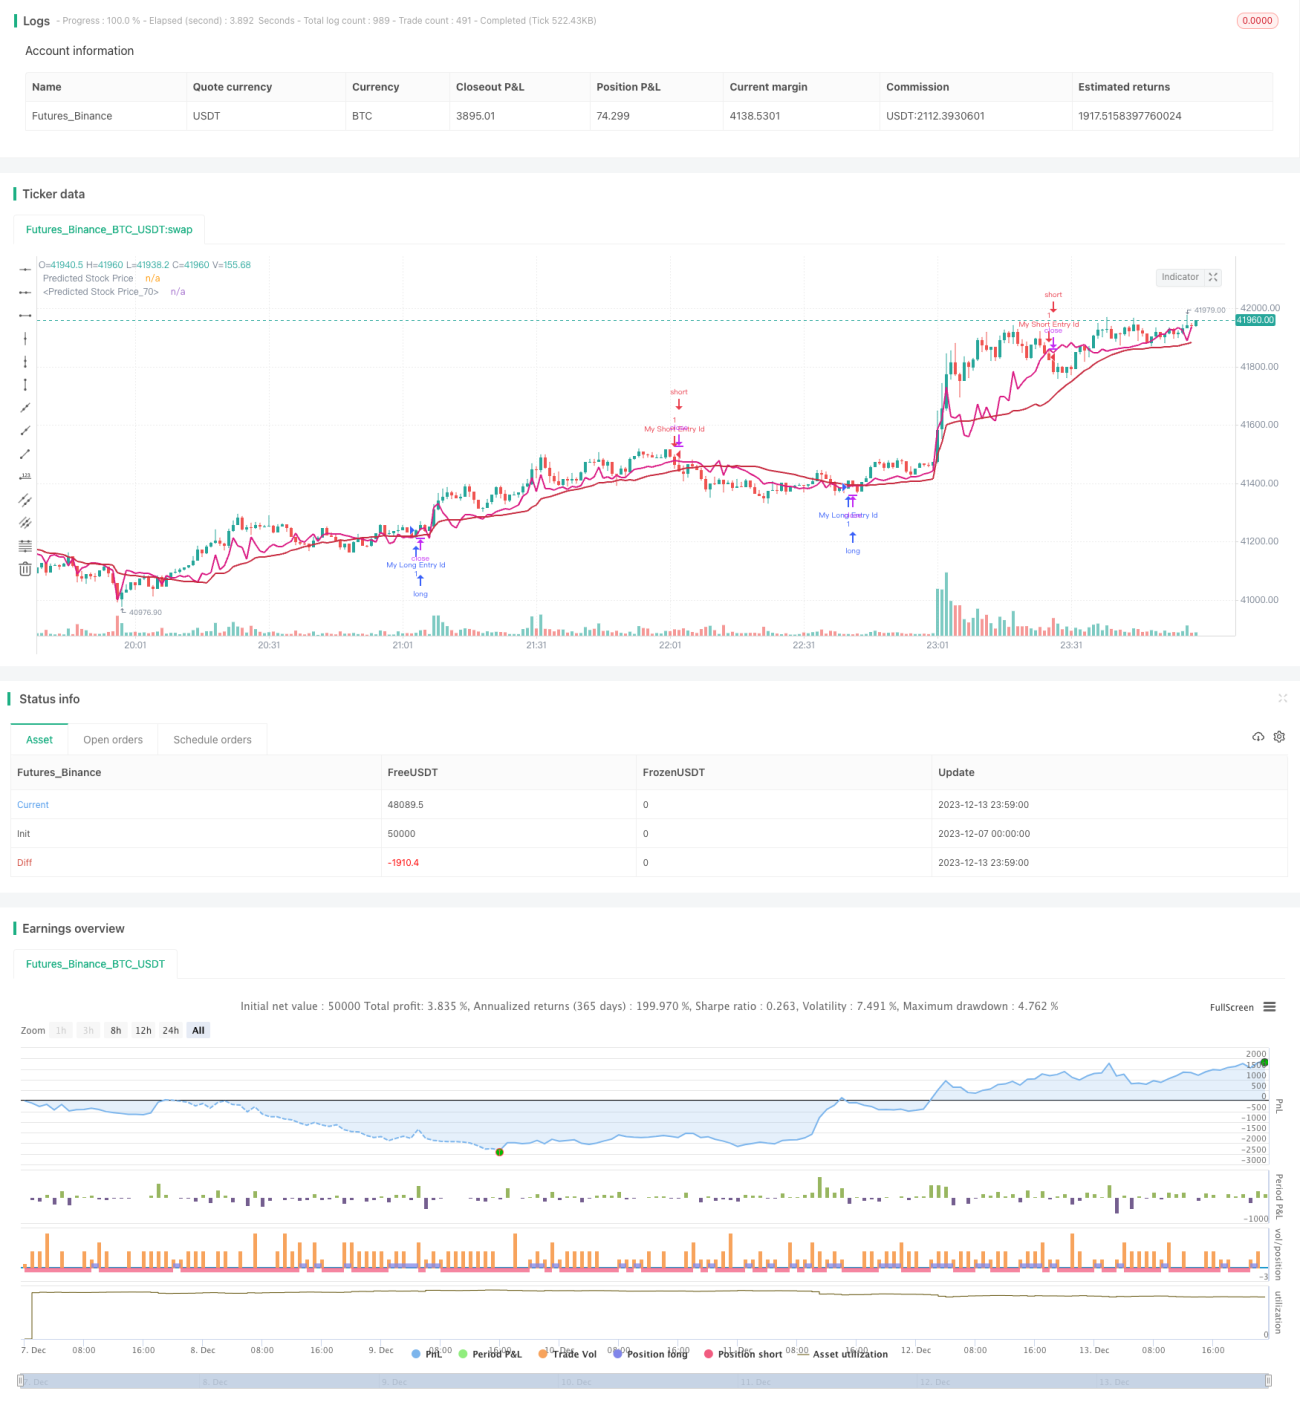
Overview: This is a quantitative strategy that utilizes linear regression to predict stock prices combined with the MACD indicator. It leverages linear regression analysis on historical prices and volumes to forecast future price trends. It then uses the MACD indicator to determine entry timing when profit opportunities emerge.
Strategy Principle:
- Calculate linear regression coefficients of prices: Fit a linear regression line based on historical volumes to predict future prices.
- Plot predicted prices: Plot the prediction line based on regression coefficients from Step 1.
- Generate buy signals: When predicted price is between open and close prices, and MACD is rising, produce buy signals.
- Generate sell signals: When MACD is falling and price is below predicted price, generate sell signals.
Advantage Analysis:
This strategy combines statistical prediction and technical indicator judgment. It derives price prediction using linear regression, avoiding subjective speculation. Meanwhile, MACD indicator can effectively determine market momentum and capture opportunities accurately. Overall, this strategy has high systematic level, accurate prediction, and controllable risks.
Risk Analysis:
Linear regression relies solely on historical data and may generate incorrect signals in response to black swan events like significantly bearish news. Also, parameter settings like regression period lengths impact strategy performance. We suggest using vwma to smooth the predicted price curve to mitigate curve jitters that affect the strategy.
Optimization Directions:
We believe this strategy can be optimized in the following aspects:
- Incorporate stop loss mechanism. Cut losses when price breaks through stop loss lines by closing positions. This effectively controls losses caused by occasional incorrect signals.
- Introduce machine learning models. Adopt more efficient models to improve prediction accuracy.
- Incorporate sentiment indicators. Include fear indices to determine market sentiment and improve win rate.
- Combine multiple timeframes. Validating predictions across periods could form a combined strategy to overcome limitations of a single timeframe.
Conclusion:
This strategy generates systematic trading signals by predicting prices with linear regression and determining entries with MACD indicator. Its advantages include clear predictive logic, controllable risks, and ample optimization space. We believe its performance will continue to excel through continuous optimizations and iterations. It provides inspirations on leveraging scientific prediction models to conduct quantitative trading and deserves further research and applications.
- 1