Dynamic Momentum Oscillator Trading Strategy

Overview
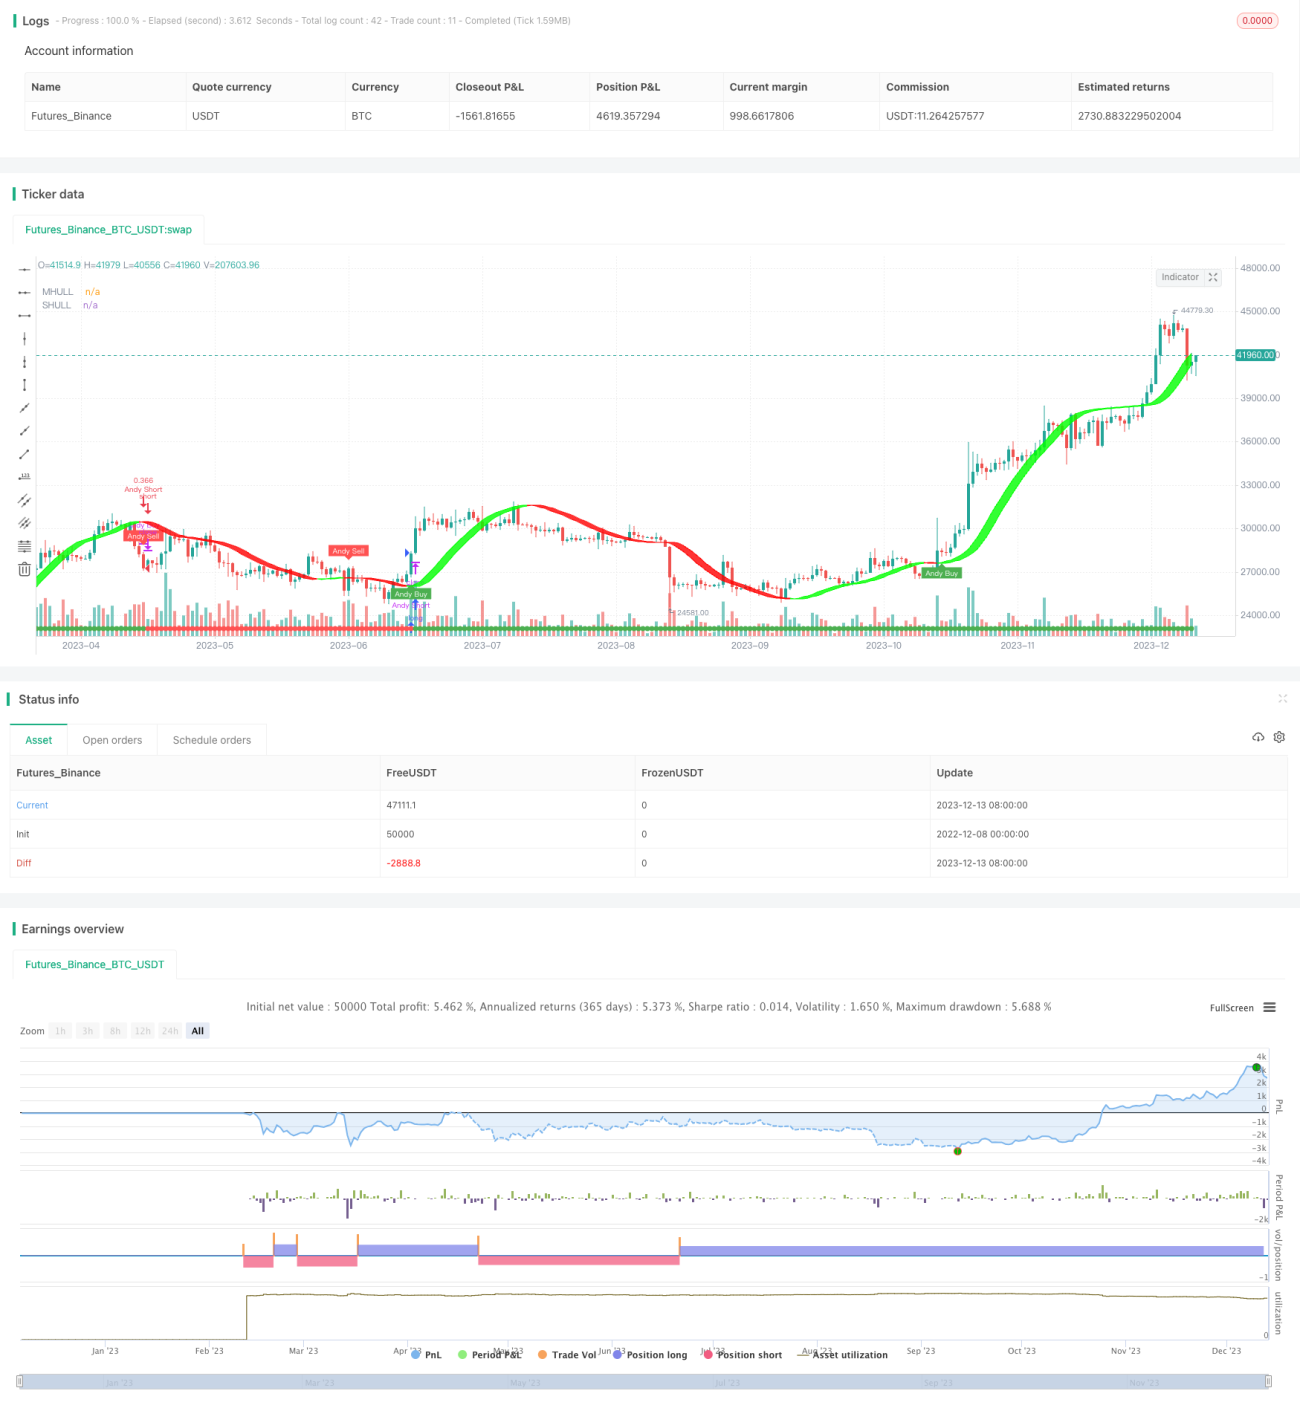
The Dynamic Momentum Oscillator (DMO) Trading Strategy is a 15-minute short-term trading strategy based on momentum oscillator indicators. This strategy combines multiple technical indicators to generate highly accurate trading signals, which can effectively assist novice traders in making buy and sell decisions within a short period of time, control risks, and increase profitability.
Strategy Logic
This strategy first uses the Doinchian Channel to determine the main trend direction of the market. A breakout above the upper band of the channel is a bullish signal, while a breakout below the lower band is a bearish signal. Secondly, the strategy adopts one of the three Hull Moving Average variants in combination with an adaptive ATR channel for more precise trend judgment. When the fast line crosses above the middle line, it is a buy signal, and when it crosses below, it is a sell signal. Finally, with the aid of the Halftrend indicator for additional filtration of false signals, the reliability of the trading signals can be further improved. Upon receipt of relatively reliable trading signals, the strategy will then enter corresponding long or short positions.
Advantage Analysis
The biggest advantage of the DMO strategy lies in the organic combination of multiple indicators. Different indicators can verify each other to filter out false signals, making each trading signal more accurate and reliable. In addition, the Doinchian channel's way of judging the main trend is simple and straightforward, and the means of filtering signals with the Halftrend line is also relatively conventional. Overall it is easy to understand with a low learning curve for beginners. Compared with single indicators, DMO can achieve higher win rates and profitability given the same number of trades.
Risk Analysis
Although the DMO strategy is relatively stable and reliable, any quantitative trading strategy is bound to carry certain risks. Specifically, when the fast line crosses below the middle line, it may still be a false signal without verification from other indicators. In addition, like all short-term strategies, DMO also faces risks associated with overtrading. If sudden market events occur that render indicators ineffective, improper stop loss settings can also lead to greater losses. To mitigate risks, it is advisable to appropriately adjust the parameters of medium and long term indicators, combine them with higher timeframe indicators for verification, and increase the stop loss distance to strictly control single trade losses.
Optimization Directions
The DMO strategy can be optimized in the following aspects: first, adjust the parameters of the Hull MA to balance the smoothing effect and sensitivity of the moving averages; second, improve the Doinchian channel logic, such as adjusting channel parameters or adding additional restrictions; third, try other indicators to replace the Halftrend for better filtration, such as Bollinger Bands, KDJ, etc.; fourth, specify appropriate trading intervals based on the characteristics of different trading instruments, for example changing it to a 5-minute or 30-minute strategy. These optimization measures can help customize the DMO strategy according to market conditions and instrument characteristics to enhance stability.
Conclusion
DMO is a short-term strategy that optimizes the combination of multiple indicators. It integrates Doinchian Channel, Hull MA and Halftrend to effectively determine market trends and generate precise trading signals. With relatively simple and intuitive techniques and easy operation, it can serve as an introductory strategy for beginners. Compared to single indicators, DMO can achieve higher win rates and profitability. Through measures like parameter tuning, combination improvements and interval specification, the DMO strategy has the potential to achieve longer-term superior performance with enhanced stability.
- 1