Bottom Reversal Strategy

1
Follow
1779
Followers
Overview
This strategy is based on market bottoms for reversal trading. It uses the lowest points of the 200-day EMA combined with Camarilla support/resistance levels to determine market bottoms. It goes long when prices bounce back.
Strategy Logic
- Calculate the lowest price EMA200Lows of the 200-day EMA. When prices close below this EMA, the market is considered near the bottom.
- Calculate the 9-day EMA of Camarilla support level 3 (S3), ema_s3_9, as an important support level.
- Also calculate the 9-day EMA of the Camarilla midpoint ema_center_9 as the signal for reversal.
- When ema_center_9 crosses over ema200Lows, and the last 3 bars are lower than ema200Lows, go long.
- Use ATR trailing stop loss to lock profit, tracking the lowest price.
- Profit targets are ema_h4_9 (Camarilla Resistance Level 4) and ema_s3_9.
Advantage Analysis
- The 200-day EMA lowest price avoids taking positions before the actual bottom.
- Camarilla levels combined with the midpoint identifies reversals reliably.
- ATR stop loss is more reasonable. Tracking lower prices allows bigger profit.
Risk Analysis
- Long holding periods increase risk. This strategy favors short-term trading.
- Large market moves can result in big stop loss. Adjust ATR parameters accordingly.
- Camarilla reversal signals are not always accurate. Expect some whipsaws.
Optimization Directions
- Consider adding indicators like RSI to supplement reversal signals.
- Research optimal parameters for different products.
- Explore machine learning for dynamic ATR stop loss.
Summary
This strategy identifies market bottoms and reversals using EMA lows and Camarilla levels. It locks in profits with ATR trailing stops. Overall it is fairly complete with practical value. Further optimizations will improve robustness.
Source
Pine
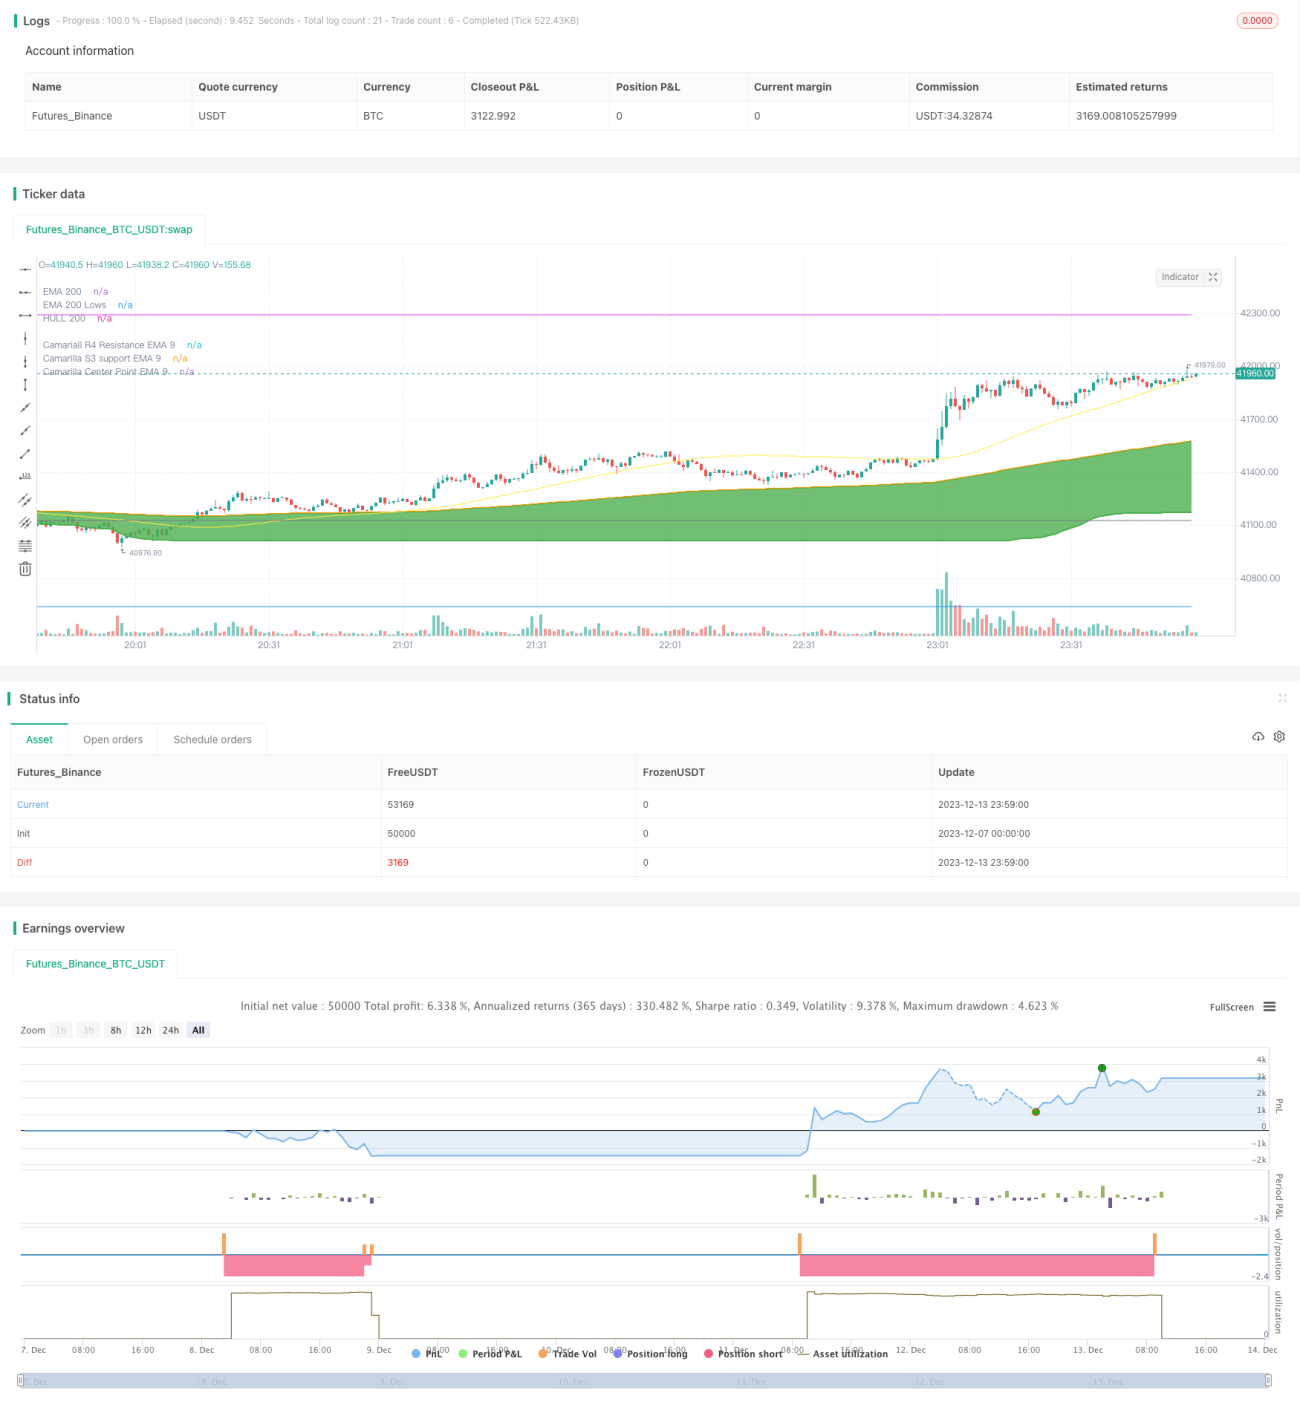
/*backtest
start: 2023-12-07 00:00:00
end: 2023-12-14 00:00:00
period: 1m
basePeriod: 1m
exchanges: [{"eid":"Futures_Binance","currency":"BTC_USDT"}]
*/

// This source code is subject to the terms of the Mozilla Public License 2.0 at https://mozilla.org/MPL/2.0/
// © mohanee

//Using the lowest of low of ema200, you can find the bottomStrategy parameters
Related strategies
Comment
All comments (0)
No data
- 1