A Multi-Factor Combination Strategy with Adaptive Moving Average

I. Strategy Overview
The multi-factor combination strategy with adaptive moving average is a compound strategy that combines the use of HA lines, moving averages, stochastic crossovers and intraday bars. It aims to uncover more trading opportunities and achieve higher cumulative returns during bull markets.
II. Strategy Logic
The core logic of this strategy is to combine multiple technical indicators to score buy and sell signals, and generate trading signals with varying strengths based on the matching results.
Specifically, the four main technical indicators used in the strategy include:
-
Intraday bars. The strategy uses the color of the intraday bars to determine price trends. Two consecutive green real-body HA bars give buy signals, while two consecutive red hollow HA bars give sell signals.
-
Moving averages. The strategy uses fast, slow and filter moving averages with different parameter settings simultaneously. When the fast line crosses above the slow line, and the slow line crosses above the filter line, it gives buy signals. And vice versa. The moving averages are good at determining medium-to-long term trends.
-
Stochastic Indicator. This indicator determines the timing of bullish and bearish crossovers. When the %K line breaks through the %D line from below, it gives buy signals. And when %K breaks %D from above, it gives sell signals.
-
Matching score mechanism. According to the matching of the above factors, the strategy adopts a scoring mechanism. The more matching factors, the stronger the corresponding trading signal.
Through the comprehensive judgment of multiple factors, the strategy can capture more subtle trading opportunities in the medium and short term, thereby achieving excess returns during bull markets.
III. Advantages
The biggest advantage of this multi-factor strategy is that it enhances the reliability of trading signals. A single technical indicator is prone to generating false signals. By combining multiple indicators, this strategy can effectively reduce interference from false signals.
In addition, compared to just following a single indicator, the multi-factor combination can improve the win rate of trades. It can achieve higher cumulative returns during bull markets.
IV. Risks
The main risk of this strategy is that the multi-factor combination itself increases the complexity of the strategy. It needs to take care of the parameter settings, frequent adjustments of multiple indicators at the same time.
Also, during bear markets, the holding time can be too long. Even with a stop loss in place, significant losses may still occur.
In addition, technical indicators like Stochastic and HA lines can be impacted by black swan events, which tend to generate false signals and cause unnecessary losses.
V. Enhancement Ideas
The strategy can be optimized in the following aspects:
-
Optimize the parameter settings of each indicator to find the optimal combination.
-
Add model training and adaptive parameter modules for real-time parameter optimization.
-
Add stop loss strategies to reduce maximum drawdown.
-
Add position control modules to dynamically adjust positions based on market conditions.
-
Incorporate machine learning algorithms to build a neural network model for the multi-factor scoring system.
VI. Conclusion
The multi-factor combination strategy with adaptive moving average combines the strengths of multiple technical indicators. It can effectively improve signal quality and achieve excess returns during bull markets. But at the same time, it also increases the complexity of the strategy, requiring further testing and optimization.
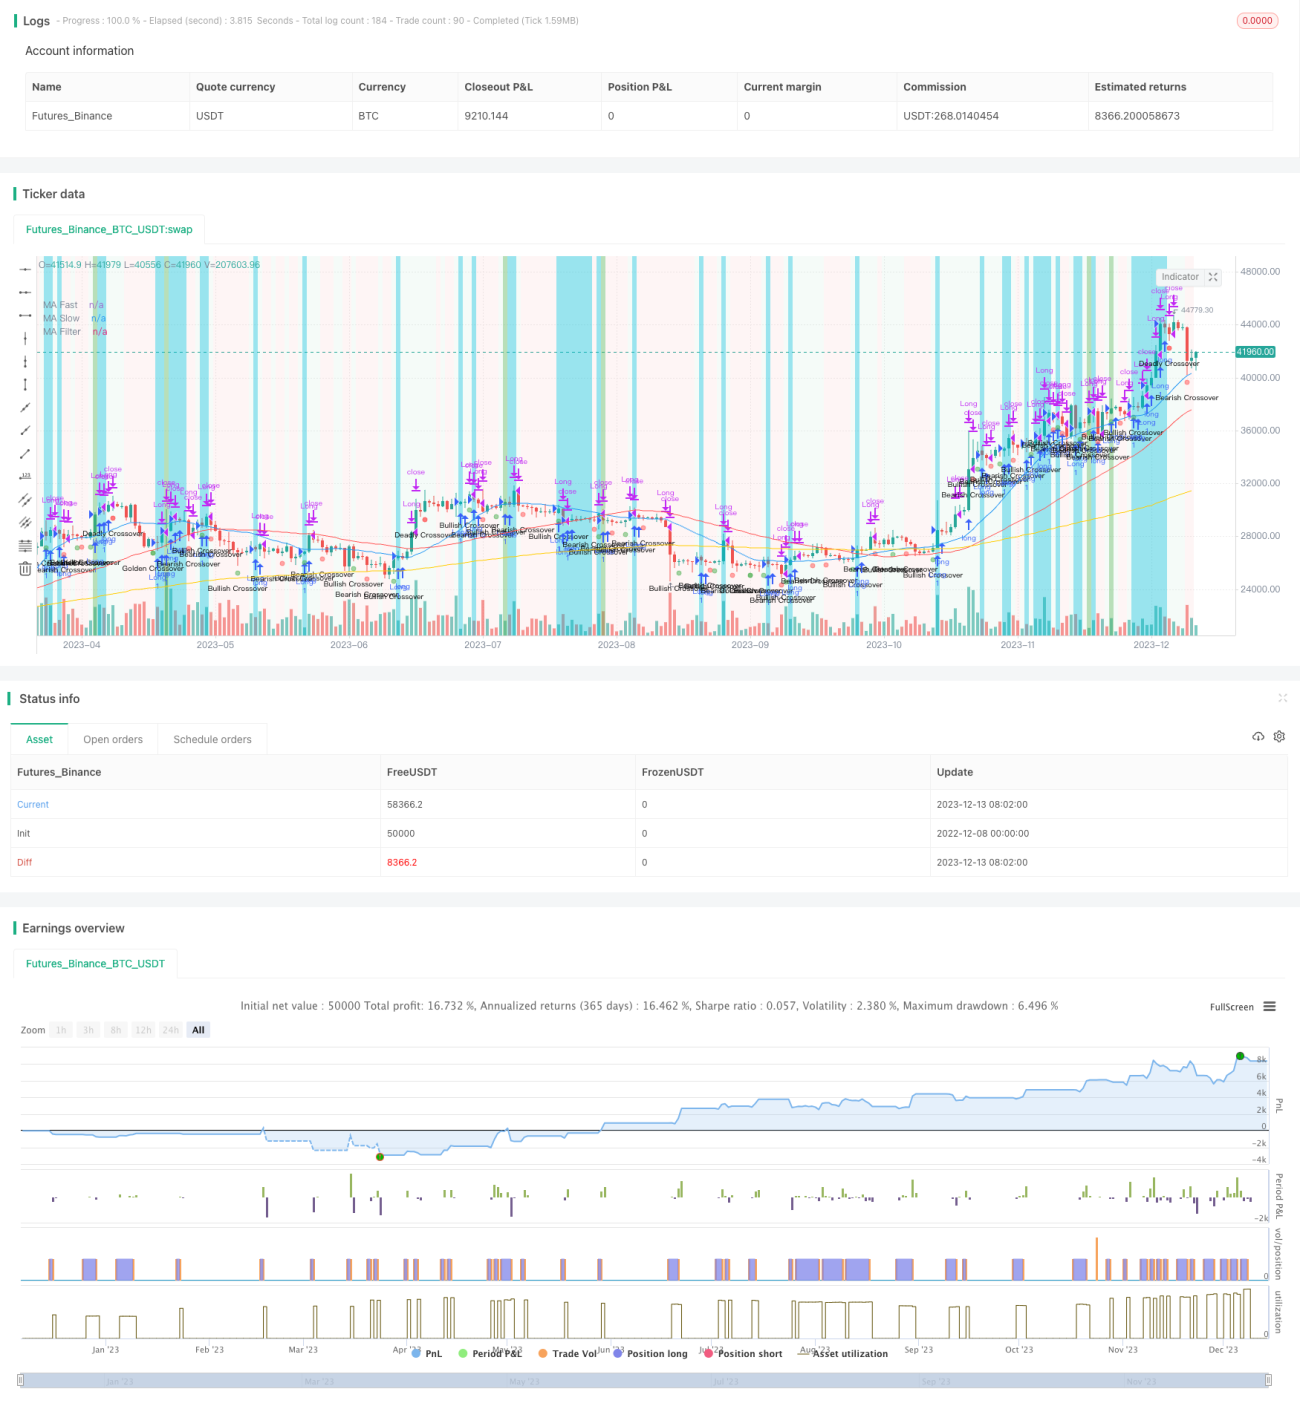
/*backtest
start: 2022-12-08 00:00:00
end: 2023-12-14 00:00:00
period: 1d
basePeriod: 1h
exchanges: [{"eid":"Futures_Binance","currency":"BTC_USDT"}]
*/

// This source code is subject to the terms of the Mozilla Public License 2.0 at https://mozilla.org/MPL/2.0/
// © cyrule
//@version=4
strategy("2nd Grade Strategy", overlay=true, shorttitle="2GTS", max_lines_count = 500, max_labels_count = 500, calc_on_every_tick = true, calc_on_order_fills = true, pyramiding = 1, default_qty_type = strategy.percent_of_equity, default_qty_value = 10)- 1