Quant Trading Strategy Based on Monthly and Quarterly Moving Average Operation

Overview
This strategy is mainly based on the moving averages of monthly and quarterly lines for operation. Specifically, the 20-day line is used as the monthly line and the 60-day line as the quarterly line. The strategy signals come from the golden cross and death cross of the two moving averages. When the monthly line crosses above the quarterly line, go long; when the monthly line falls below the quarterly line, close positions. This strategy is suitable for medium- and long-term operations to capture consolidation and divergence opportunities.
Strategy Logic
This strategy uses the 20-day simple moving average as the monthly line indicator and the 60-day simple moving average as the quarterly line indicator. The specific trading signal generation logic is as follows:
- When the 20-day line crosses above the 60-day line, that is, a golden cross occurs, go long.
- When the price retreats more than 10% from the highest point in the last 10 days, close long positions for profit taking.
- When the 20-day line crosses below the 60-day line, that is, a death cross occurs, close all positions.
- When the loss reaches 10%, stop loss.
Use the moving average crossovers of monthly and quarterly lines to determine medium- and long-term trends. The golden cross for going long indicates the start of a medium- and long-term bull market, while the death cross for going short indicates the start of a medium- and long-term bear market. At the same time, use stop profit and stop loss strategies to control risks.
Advantages of the Strategy
- Using monthly and quarterly moving averages filters out market noise and captures medium- and long-term trends.
- The strategy parameters are simple and easy to implement.
- Customizable take profit and stop loss parameters to control risks.
Risk Analysis
- Unable to determine trend reversal points, with risk of losses.
- Monthly and quarterly moving averages have lagging effects, potentially missing short-term opportunities.
- Need to select appropriate stop loss points to avoid being stopped out too quickly.
Solutions:
- Adopt trailing stop loss to stop out in a timely manner.
- Incorporate other indicators to filter signals and determine trends.
- Adjust moving average parameters to optimize the strategy.
Directions for Strategy Optimization
- Add other indicators for filtering, such as KD indicator, etc., to avoid false breakouts.
- Optimize moving average parameters to find the best parameter combination.
- Incorporate additional take profit strategies such as trailing take profit to capture more profits.
Summary
This strategy systematically utilizes the advantages of monthly and quarterly moving averages by judging medium- and long-term trend directions through golden cross and death cross of the moving averages. At the same time, reasonable stop loss and take profit mechanisms are configured to control risks. There is still much room for optimizing this strategy, worth further testing and optimization.
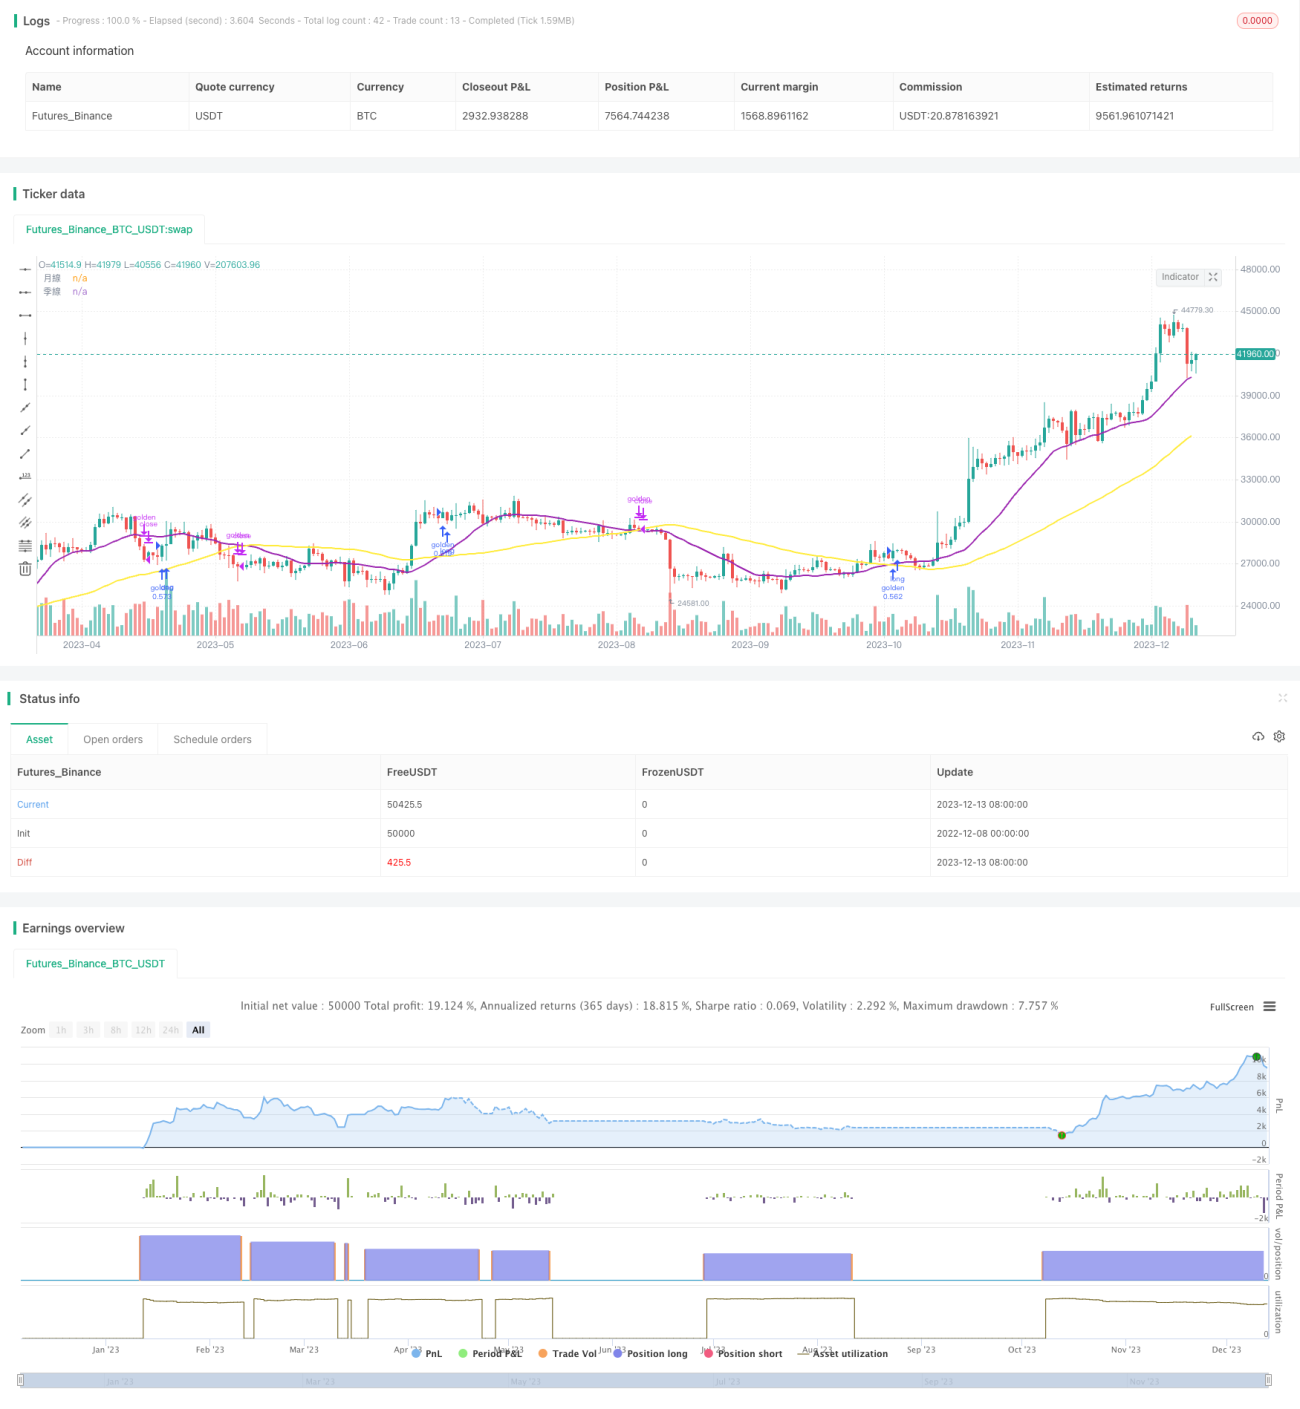
/*backtest
start: 2022-12-08 00:00:00
end: 2023-12-14 00:00:00
period: 1d
basePeriod: 1h
exchanges: [{"eid":"Futures_Binance","currency":"BTC_USDT"}]
*/

//@version=4
strategy("均線操作-月季", overlay=true, initial_capital = 100000, default_qty_type = strategy.percent_of_equity, default_qty_value = 30)
sma20 = sma(close, 20)
sma60 = sma(close, 60)- 1