Consolidation Breakout Strategy

Author: ChaoZhang, Date: 2023-12-15 11:59:08
Tags:

img

Overview

This strategy is a day trading intraday consolidation breakout indicator for the Indian markets. It incorporates time condition, commission, and stop-loss trailing. The advantages of this strategy include clear logic, flexible parameter tuning, and adaption to market dynamics. However, certain risks exist and need further optimization.

Strategy Logic

The core strategy is based on Bollinger Bands. It uses a LENGTH-period simple moving average as the mid-line and up/low bands are +MULT/-MULT standard deviations. Buy signals are generated when close breaks above the upper band, and sell signals are generated when close breaks below the lower band, forming Range Breakout strategy.

For risk control, it uses ATR for stop loss line. It also considers the Indian market trading hours and close all positions at 14:57 everyday.

Advantage Analysis

The advantages of this strategy:

  1. Clear logic, easy parameter tuning, flexible adaption
  2. Incorporate stop loss and timing control for risk management
  3. Consider specifics of Indian markets for localization
  4. Reasonable trading frequency, avoid over-trading
  5. Good extensibility for further optimization

Risk Analysis

The risks of this strategy:

  1. Bollinger Bands relies on parameter tuning based on experience
  2. Single indicator susceptible to false signals
  3. ATR stop loss can only control limited risks
  4. Black swan events not considered

Risks can be reduced by:

  1. Combining multiple indicators for signal filtering
  2. Optimizing parameter tuning rules
  3. Incorporating gap trading logic
  4. Enhancing stop loss robustness
  5. Combining market sentiment indices

Optimization Directions

The strategy can be optimized in several directions:

  1. Optimizing parameter tuning for better adaptiveness
  2. Adding more indicators to avoid false signals
  3. Enhancing stop loss robustness
  4. Incorporating more analysis for trend detection
  5. Consider auto position sizing

With model and algorithm optimization, the Parameter Tuning and Signal Filtering capabilities can be improved for broader adaption and higher risk tolerance.

Conclusion

In summary, this is a straightforward intraday breakout strategy. It addresses the Indian market specifics and controls trading risks. With further improvements on Parameter Tuning and Signal Filtering, this strategy can meet the requirement for commercialization.
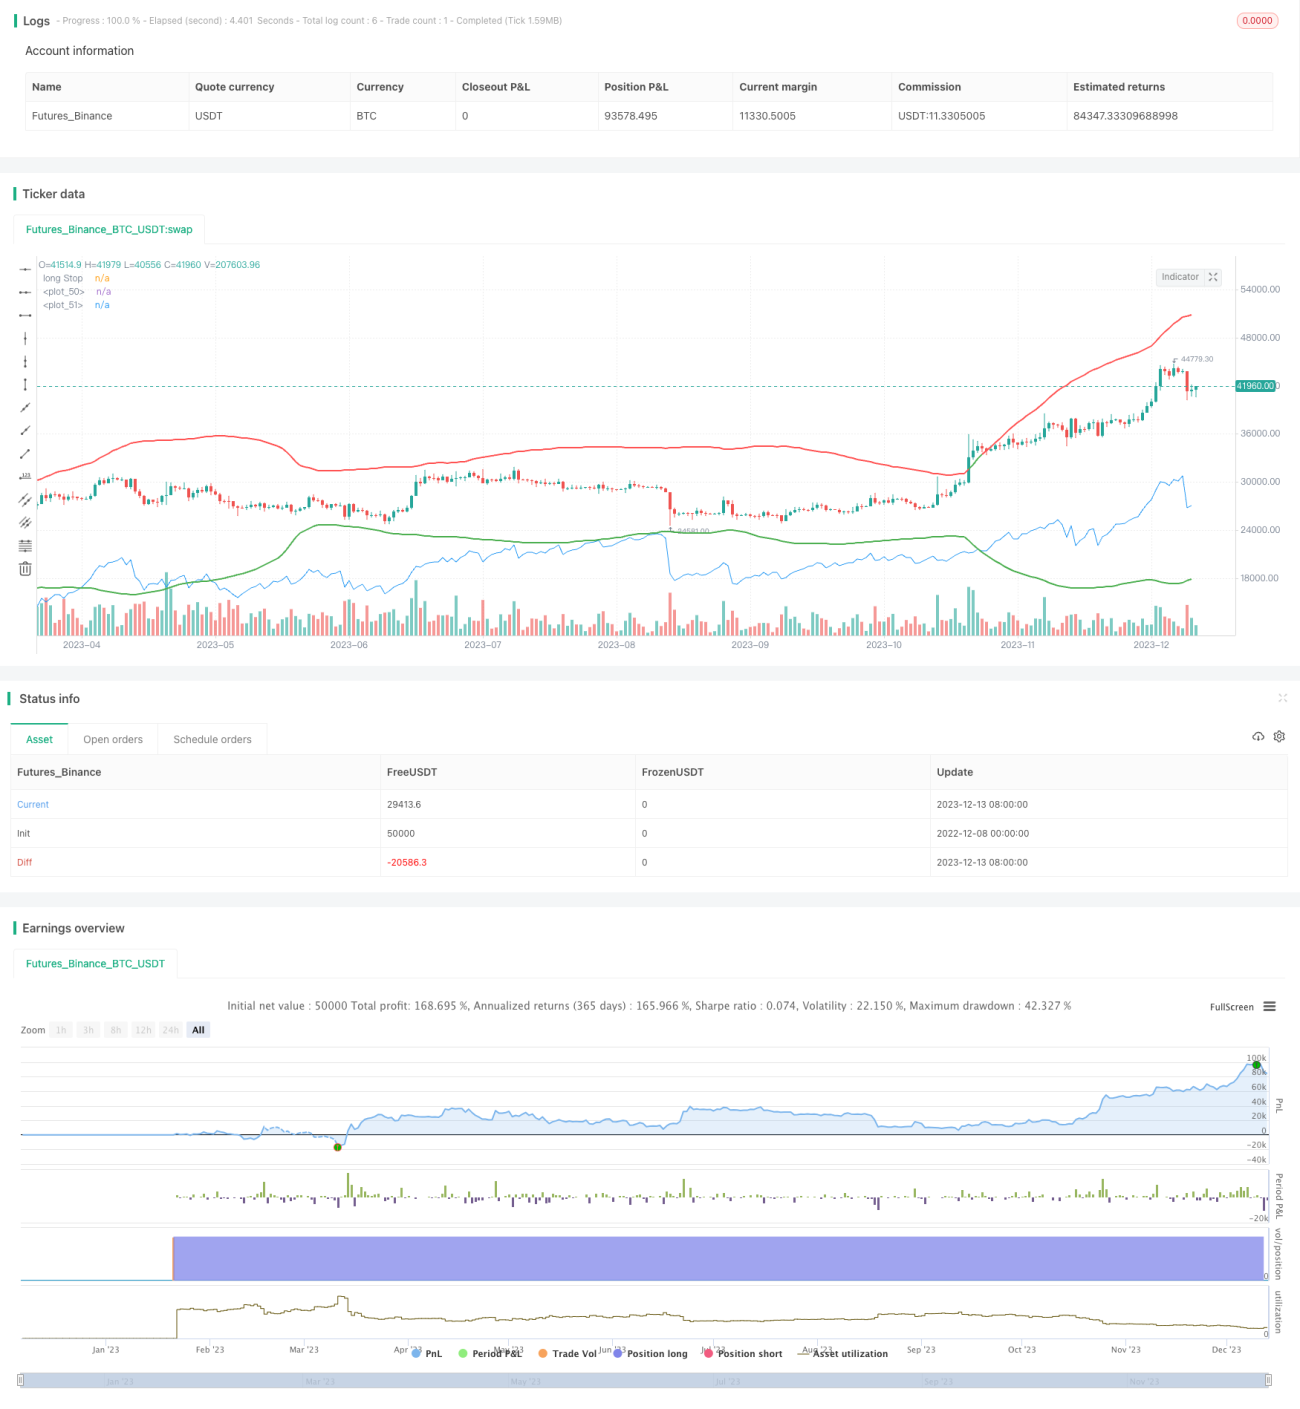

/*backtest
start: 2022-12-08 00:00:00
end: 2023-12-14 00:00:00
period: 1d
basePeriod: 1h
exchanges: [{"eid":"Futures_Binance","currency":"BTC_USDT"}]
*/

//@version=5
strategy("Consolidation Breakout [Indian Market Timing]",overlay = true , pyramiding = 0 ,initial_capital = 50000, default_qty_value=5, currency = currency.NONE,commission_type = strategy.cash, commission_value = 30, slippage = 1 )


// ══════════════════════════════════//
// ————————> INPUT VALUES <————————— //
// ══════════════════════════════════//

LENGTH = input.int(title='LENGTH', defval = 75, minval = 10 ,maxval = 300)
MULT = input.float(title='MULT_STDEV',defval = 3.2 , minval = 1 , maxval = 7 , step =0.1)

//EMA1 = input.int(title='EMA1', defval = 50, minval = 10 ,maxval = 550)
//EMA2 = input.int(title='EMA2', defval = 135, minval = 10 ,maxval = 550)
factor_tr = input.float(title = "ATR TRAIL", defval = 10, step = 0.1)

// ══════════════════════════════════//
// ————————> DAY TIME LIMIT <——————— //
// ══════════════════════════════════//

t = time(timeframe.period, '0935-1430:1234567')
time_condition = not na(t)

//**********************// ════════════════════════════════//
//**********************// ————————> ATR & PLOT <————————— //
//**********************// ════════════════════════════════//
//ema1 = ta.ema(close,EMA1)
//ema2 = ta.ema(close,EMA2)

//plot(ema1, color=color.new(color.blue, 0), style=plot.style_linebr, title='ema1')
//plot(ema2, color=color.new(color.yellow, 0), style=plot.style_linebr, title='ema2')

atr_tr = ta.atr(16)*factor_tr

longStop = close - atr_tr
shortStop = close + atr_tr

Entry = close
length = LENGTH
mult = MULT
basis = ta.sma(Entry , length)
dev = mult * ta.stdev(Entry , length)
upper = (basis + dev)
lower = (basis - dev)
buyEntry = ta.crossover(Entry , upper)
sellEntry = ta.crossunder(Entry , lower)

//plot(upper, color=color.new(color.red, 0), style=plot.style_linebr, title="short stop")
//plot(lower, color=color.new(color.green, 0), style=plot.style_linebr, title="Long stop")

plot(upper, color=close[1] > upper and close > upper ? color.green : color.red, linewidth=2)
plot(lower, color=close[1] > lower and close > lower ? color.green : color.red, linewidth=2)


// ══════════════════════════════════//
// ————————> LONG POSITIONS <————————//
// ══════════════════════════════════//
//******barinstate.isconfirmed used to avoid repaint in real time*******

if ( buyEntry and strategy.opentrades==0 and barstate.isconfirmed and time_condition)
    strategy.entry(id= "Long" ,direction = strategy.long, comment = "B")
    
plot(longStop , color=color.new(color.blue, 0), style=plot.style_linebr, title='long Stop')

if strategy.position_size > 0 
    strategy.exit("long tsl", "Long" , stop = longStop , comment='S')

// ═════════════════════════════════════//
// ————————> SHORT POSITIONS <————————— //
// ═════════════════════════════════════//
if ( sellEntry and strategy.opentrades==0 and barstate.isconfirmed and time_condition)
    strategy.entry(id = "Short" ,direction = strategy.short,  comment = "S") 

if strategy.position_size < 0
    strategy.exit("short tsl", "Short" , stop = shortStop ,comment='B')

// ════════════════════════════════════════════════//
// ————————> CLOSE ALL POSITIONS BY 3PM <————————— //
// ════════════════════════════════════════════════//
strategy.close_all(when = hour == 14 and minute == 57)


More