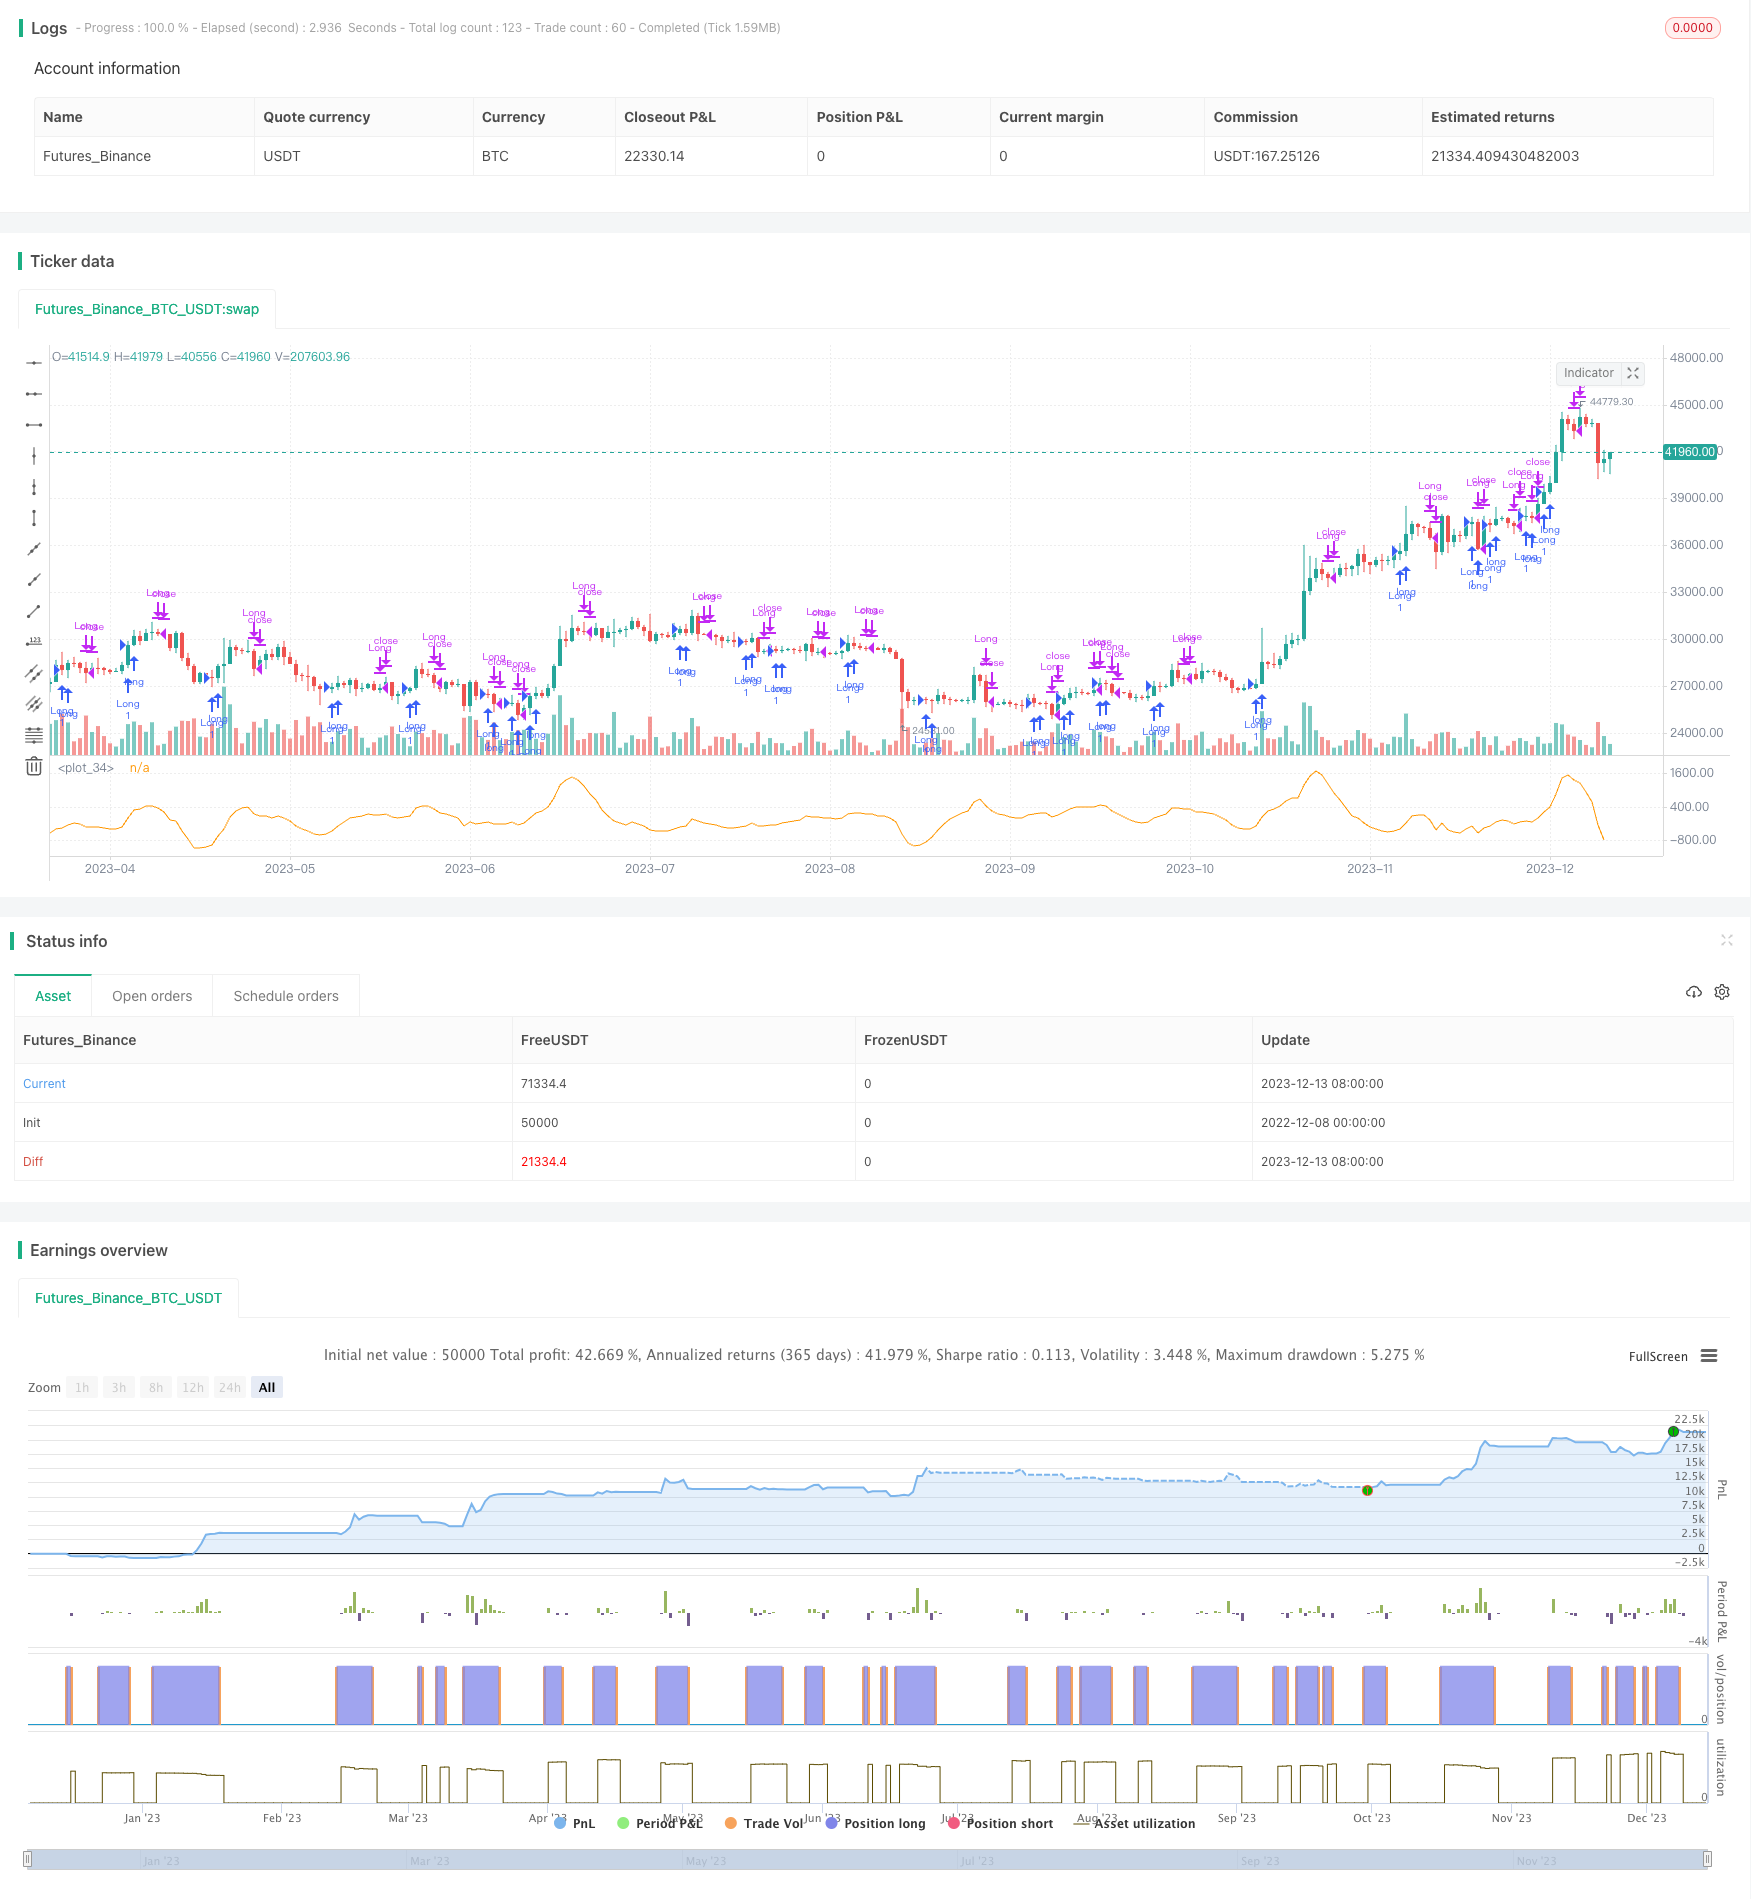
MACD Long Reversal Strategy

Author: ChaoZhang, Date: 2023-12-15 13:55:38
Tags:

img

Overview

The MACD long reversal strategy is a strategy that utilizes the MACD indicator to identify long-term price reversals and makes long-term trades. This strategy constructs the MACD indicator using the fast SMA line and slow SMA line difference of MACD, and uses the reversal pattern of the MACD histogram to identify potential long-term reversal opportunities in prices. When a price reversal opportunity is identified, the strategy will make a directional long-term entry.

Strategy Logic

The strategy uses 6-day EMA as the fast line of MACD and 26-day EMA as the slow line of MACD. The difference between the fast and slow lines is the MACD, and the 9-day SMA of MACD constitutes the signal line. When the difference between the fast and slow lines, i.e. the histogram, equals zero, it represents a balance; when positive, it represents a long-term bullish view; when negative, it represents a long-term bearish view.

The trading logic of this strategy is: When the MACD histogram rises above the previous one (the difference widens), it is considered that the price has reversed to long-term bullish (buying opportunity); When the MACD histogram falls below the previous one (the difference narrows), the price is considered to have reversed to long-term bearish (selling opportunity). To filter out false signals, this strategy will wait for the actual reversal of two histograms before entering.

Advantage Analysis

  • Identify long-term price reversals using the long-term moving average difference of the MACD indicator
  • The double-line crossover filters out false breakouts and avoids chasing highs and selling lows
  • MACD parameters are adjustable to adapt to different market environments
  • Stop loss strategies can be configured to control single loss

Risks and Solutions

  • Missing trading opportunities due to MACD divergence
    • Optimize to use in combination with RSI indicator
  • There are many false reversal signals in oscillating markets
    • Increase trailing stop loss to reduce losses; Adjust MACD parameters to pursue smoothness
  • The reversal does not hold or the price breaks through the stop loss
    • Use exponential moving averages to improve stop loss reliability
  • No stop loss strategy, unable to control losses
    • Add trailing stop loss or fixed stop loss logic to strictly control single loss amount

Optimization Directions

  • Adjust MACD parameters to pursue smoother MACD lines. MACD is a long-term trend tracking indicator, being too sensitive will increase false signals.
  • Add trailing stop loss logic. Long-term holdings inevitably face the risk of pullbacks, and trailing stops can mitigate that risk.
  • Use in combination with other indicators like RSI. Single indicator effects are limited, combining other indicators can improve performance.
  • Add position sizing module. Different market conditions can use different holding strategies.

Summary

The MACD long reversal strategy captures long-term reversal opportunities in prices by judging the reversal of the MACD histogram. This strategy successfully controls the conflict between short-term and long-term cycles, as well as avoiding chasing highs and selling lows. However, as a single indicator strategy, the MACD long reversal strategy also has certain limitations, and there is still room for further optimization, especially when used in combination with other indicators.


/*backtest
start: 2022-12-08 00:00:00
end: 2023-12-14 00:00:00
period: 1d
basePeriod: 1h
exchanges: [{"eid":"Futures_Binance","currency":"BTC_USDT"}]
*/

// This source code is subject to the terms of the Mozilla Public License 2.0 at https://mozilla.org/MPL/2.0/
// © TheGrindToday

//@version=4
strategy("MACD Long Strat", overlay=false)


//fast = 12, slow = 26
fast = 6, slow = 26
fastMA = ema(close, fast)
slowMA = ema(close, slow)
macd = fastMA - slowMA
signal = sma(macd, 9)
histogram = macd-signal

macdpos = histogram[0] > 0
macdneg = histogram[0] < 0

histogram_reversing_negative = histogram[1] > histogram[2]


LongEntryCondition =  histogram > histogram[1] 
ShortEntryCondition =  histogram < histogram[1]

exitConditionLong = histogram[0] < histogram[2]

if (LongEntryCondition and histogram_reversing_negative)
    strategy.entry("Long", strategy.long)


if (exitConditionLong)
    strategy.close("Long")
    
plot(histogram)


More