Momentum Indicator Decision Trading Strategy

Author: ChaoZhang, Date: 2023-12-15 15:31:52
Tags:

img

Overview

The Momentum Indicator Decision Trading Strategy is a trend following strategy. It builds a momentum indicator using double exponential moving average and combines it with price rate of change indicator to generate trading signals. When the momentum indicator goes up, it generates long signals. When the momentum indicator goes down, it generates short signals. This strategy suits traders who want to track mid-term trends in the market.

Strategy Principle

The strategy uses Decision Point oscillator based on double exponential moving average to measure momentum. First it calculates the daily price change rate, then uses 31-day and 20-day double exponential moving averages to smooth the price change rate separately. Finally it uses a 9-day smoothed moving average to issue trading signals. When the fast line is above the slow line, it indicates a bull market. When the fast line is below the slow line, it indicates a bear market.

The strategy also introduces a price rate of change indicator to avoid wrong signals in sideways markets. Specifically, it calculates the percentage price change over the past 30 days, and judges whether the market is active through its moving average. Trading signals are only issued when the market is active.

Advantage Analysis

The strategy combines momentum indicator and price rate of change indicator, which can effectively identify mid-term trends and avoid frequent trading in volatile markets. Compared to simple trend following strategies like moving average, it can greatly reduce the probability of wrong trades. In addition, risk is controlled by setting stop loss points to cut losses in time and effectively control per trade loss.

Risk Analysis

The strategy mainly relies on mid-long term trend trading, unable to capture short-term price fluctuations. When there is a sharp market movement, the stop loss point may be broken, leading to greater losses. In addition, inappropriate parameter settings can also affect the strategy. For example, if the double exponential moving average parameters are set too short, the probability of wrong trades will increase.

To prevent risks, stop loss points can be adjusted appropriately to expand stop loss range. When a sharp market movement happens, the strategy can be temporarily turned off to avoid the probability of stop loss being broken. For parameter tuning, detailed backtesting should be performed to select the optimal parameters.

Optimization Directions

The strategy can be optimized in the following aspects:

  1. Add other filtering indicators like volatility indicator to avoid trading during periods of sharp market fluctuations.

  2. Add machine learning models to assist judgment of trend direction and strength, which can improve signal accuracy.

  3. Try different momentum indicators like Relative Strength Index, Stochastic oscillator to optimize entry and exit timing.

  4. In live trading, dynamically adjust parameters combined with recent market conditions to pursue optimal parameter combination.

Conclusion

The Momentum Indicator Decision Trading Strategy is generally a steady mid-long term trend following strategy. It effectively identifies trends and avoids wrong trades by combining double exponential moving average momentum indicator and price rate of change indicator. Meanwhile, it controls risk by setting stop loss points. If parameters are tuned properly and backtest results are good, it suits mid-long term investors who pursue excess returns. Of course, traders still need to be aware of the risk brought by sharp market fluctuations to the strategy.
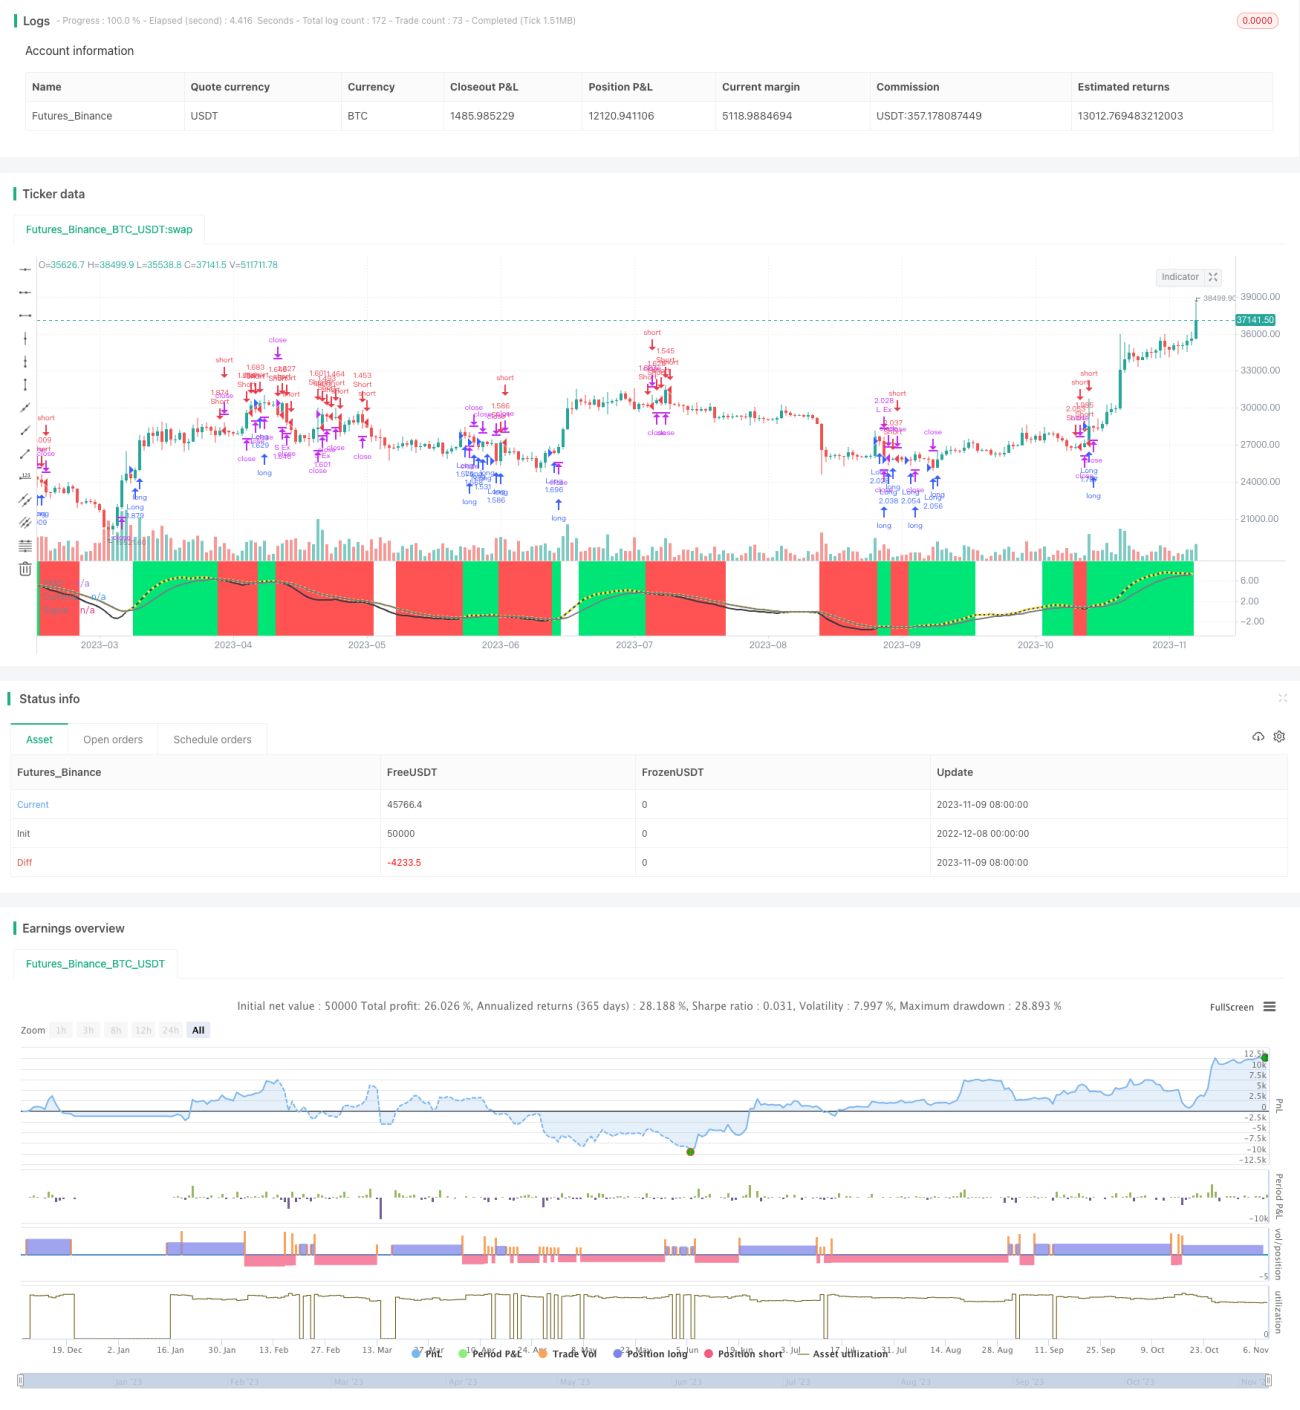

/*backtest
start: 2022-12-08 00:00:00
end: 2023-11-10 00:00:00
period: 1d
basePeriod: 1h
exchanges: [{"eid":"Futures_Binance","currency":"BTC_USDT"}]
*/

//@version=4
strategy("Decision BF", overlay=false, initial_capital=10000, default_qty_type=strategy.percent_of_equity, default_qty_value=100, commission_type=strategy.commission.percent, commission_value=0.075)

/////////////// Time Frame ///////////////
testStartYear = input(2017, "Backtest Start Year") 
testStartMonth = input(1, "Backtest Start Month")
testStartDay = input(1, "Backtest Start Day")
testPeriodStart = timestamp(testStartYear,testStartMonth,testStartDay, 0, 0)

testStopYear = input(2019, "Backtest Stop Year")
testStopMonth = input(12, "Backtest Stop Month")
testStopDay = input(31, "Backtest Stop Day")
testPeriodStop = timestamp(testStopYear,testStopMonth,testStopDay, 0, 0)

testPeriod() => true

/////////////// Decision ///////////////
src = input(ohlc4, title="Source")
length1 = input(31, title="First Smoothing")
length2 = input(20, title="Second Smoothing")
siglength = input(9, title="Signal Smoothing")
fr = input(true, title="Fill Region")

calc_csf(src, length) => 
	sm = 2.0 / length
	csf = 0.0
	csf := (src - nz(csf[1])) * sm + nz(csf[1])
	csf
i = (src / nz(src[1], src)) * 100
pmol2 = calc_csf(i - 100, length1)
pmol = calc_csf(10 * pmol2, length2)
pmols = ema(pmol, siglength)
d = pmol - pmols
duml = plot(fr ? (d > 0 ? pmol : pmols) : na, style=plot.style_circles, color=color.yellow, linewidth=0, title="DummyL")

hc = d > 0 ? d > d[1] ? color.lime : color.green : d < d[1] ? color.red : color.orange

///////////// Rate Of Change ///////////// 
source = close
roclength = input(30, minval=1)
pcntChange = input(7, minval=1)
roc = 100 * (source - source[roclength]) / source[roclength]
emaroc = ema(roc, roclength / 2)
isMoving() => emaroc > (pcntChange / 2) or emaroc < (0 - (pcntChange / 2))

/////////////// Strategy ///////////////
long = d > 0 and isMoving() 
short = d < 0 and isMoving() 

last_long = 0.0
last_short = 0.0
last_long := long ? time : nz(last_long[1])
last_short := short ? time : nz(last_short[1])

long_signal = crossover(last_long, last_short)
short_signal = crossover(last_short, last_long)

last_open_long_signal = 0.0
last_open_short_signal = 0.0
last_open_long_signal := long_signal ? open : nz(last_open_long_signal[1])
last_open_short_signal := short_signal ? open : nz(last_open_short_signal[1])

last_long_signal = 0.0
last_short_signal = 0.0
last_long_signal := long_signal ? time : nz(last_long_signal[1])
last_short_signal := short_signal ? time : nz(last_short_signal[1])

in_long_signal = last_long_signal > last_short_signal
in_short_signal = last_short_signal > last_long_signal

last_high = 0.0
last_low = 0.0
last_high := not in_long_signal ? na : in_long_signal and (na(last_high[1]) or high > nz(last_high[1])) ? high : nz(last_high[1])
last_low := not in_short_signal ? na : in_short_signal and (na(last_low[1]) or low < nz(last_low[1])) ? low : nz(last_low[1])

sl_inp = input(2.0, title='Stop Loss %') / 100
tp_inp = input(5000.0, title='Take Profit %') / 100
 
take_level_l = strategy.position_avg_price * (1 + tp_inp)
take_level_s = strategy.position_avg_price * (1 - tp_inp)

since_longEntry = barssince(last_open_long_signal != last_open_long_signal[1]) 
since_shortEntry = barssince(last_open_short_signal != last_open_short_signal[1])

slLong = in_long_signal ? strategy.position_avg_price * (1 - sl_inp) : na
slShort = strategy.position_avg_price * (1 + sl_inp)
long_sl = in_long_signal ? slLong : na
short_sl = in_short_signal ? slShort : na

/////////////// Execution ///////////////
if testPeriod()
    strategy.entry("Long",  strategy.long, when=long)
    strategy.entry("Short", strategy.short, when=short)
    strategy.exit("L Ex", "Long", stop=long_sl, limit=take_level_l, when=since_longEntry > 0)
    strategy.exit("S Ex", "Short", stop=short_sl, limit=take_level_s, when=since_shortEntry > 0)

/////////////// Plotting ///////////////
sigl = plot(false ? na : pmols, title="PMO Signal", color=color.gray, linewidth=2, title="Signal")
mdl = plot(false ? na : pmol, title="PMO", color=color.black, linewidth=2, title="PMO")
fill(duml, sigl, color.green, transp=20, title="PosFill")
fill(duml, mdl, color.red, transp=20, title="NegFill")
bgcolor(isMoving() ? long ? color.lime : short ? color.red : na : color.white, transp=70)
bgcolor(long_signal ? color.lime : short_signal ? color.red : na, transp=50)

More