Dual Moving Average Triple Exponential Indicator Trading Strategy

Overview
This strategy uses dual moving average indicators and triple exponential moving average indicators, combined with stochastic indicators, to form a relatively stable and reliable trend tracking trading strategy. Its main idea is to issue trading signals when the moving average indicator detects golden crosses or death crosses; while the stochastic indicator is used to assist in judging overbought and oversold situations to avoid generating wrong signals during drastic market fluctuations.
Principles
This strategy consists mainly of four parts:
-
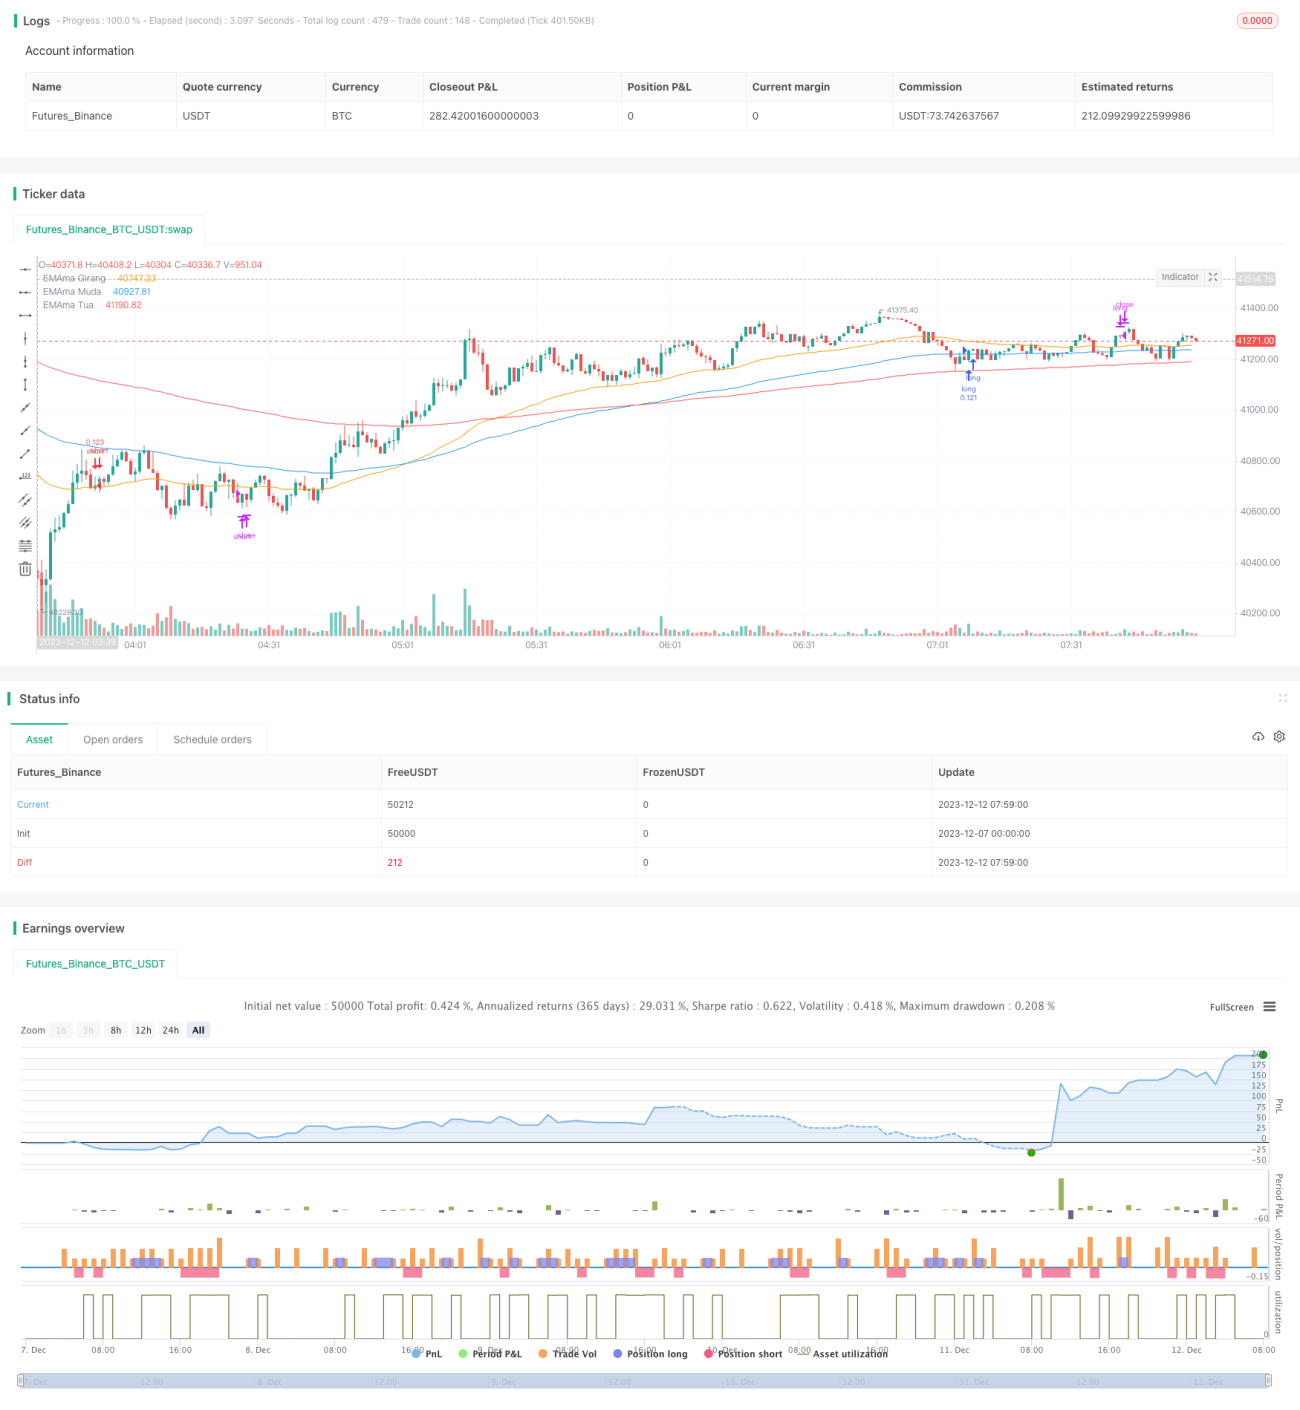
Dual Moving Average Indicator: Calculates the 50-period and 100-period exponential moving averages (EMA) respectively. It generates a buy signal when the short-term EMA crosses above the long-term EMA, and a sell signal when crossing below.
-
Triple Exponential Indicator: Calculates the 50-period, 100-period and 200-period exponential moving averages to determine the market trend direction. When 50EMA>100EMA>200EMA, it is a bullish market. When 50EMA<100EMA<200EMA, it is a bearish market.
-
Stochastic Indicator: Calculates the 6-day K and D values of RSI to determine overbought and oversold conditions. When the K value crosses above the D value, it is oversold. When crossing below, it is overbought.
-
Trading Signals: Only when the dual moving average indicator generates a signal at the same time when the market conforms to the bullish or bearish state of the triple exponential moving average, and the stochastic indicator does not show overbought or oversold, will true trading orders be issued.
Advantages
This strategy combines the advantages of moving average indicators and stochastic indicators. It takes into account both the judgment of trend direction and the overbought/oversold state of the market when issuing trading signals, thereby filtering out noise more effectively to track clearer trends. In addition, it uses the triple exponential moving average to determine the overall trend, making the signals more reliable. This strategy is simple, easy to implement, and easy to optimize.
Risks and Countermeasures
The biggest risk of this strategy is that it relies on indicator judgments. When the indicator gives out wrong signals, it can easily lead to failed trades. In addition, when using longer cycle moving averages to determine the overall trend, some short-term opportunities may also be missed out. The main risk countermeasures are as follows:
-
Optimize indicator parameters and adjust the cycle combinations of dual moving averages and triple exponential moving averages to match them better to market characteristics.
-
Incorporate more indicators for CANCEL operations, terminating current trades when the market shows drastic fluctuations.
-
Employ auxiliary short-term bullish strategies to capitalize on short-term opportunities in long-term bull markets.
Optimization Directions
The main aspects where this strategy can be optimized include:
-
Adjust the cycle parameters of the dual moving average and triple exponential moving average to optimize the indicators’ adaptation to market characteristics.
-
Increase VOLUME, MACD and other judgments to avoid abnormal price movements causing wrong signals.
-
Better confirm trends using candlestick patterns to avoid wrong signals after short-term pullbacks.
-
Expand it to more varieties like stocks, forex and test adaptability of the strategy.
-
Incorporate VIX indicators to determine overall market volatility and control position sizing.
Conclusion
This strategy uses dual moving average indicators to issue trading signals, with triple exponential moving averages and stochastic indicators as complements, thereby constructing a relatively stable trend tracking strategy. It is simple, easy to implement, highly matched with market characteristics, delivering stable returns. It is a worthwhile quantitative strategy to recommend. Through targeted optimizations, it has the potential to achieve even better results.
/*backtest
start: 2023-12-07 00:00:00
end: 2023-12-12 08:00:00
period: 1m
basePeriod: 1m
exchanges: [{"eid":"Futures_Binance","currency":"BTC_USDT"}]
*/

//@version=5
strategy(title='5212 EMA Strategy', shorttitle='5212 EMA', overlay=true, pyramiding=0, default_qty_type=strategy.percent_of_equity, default_qty_value=10, calc_on_every_tick=false)

//**Backtest Date sof- 1