Price Deviation from Daily Average Trading Strategy

Author: ChaoZhang, Date: 2023-12-15 15:44:18
Tags:

img

Overview

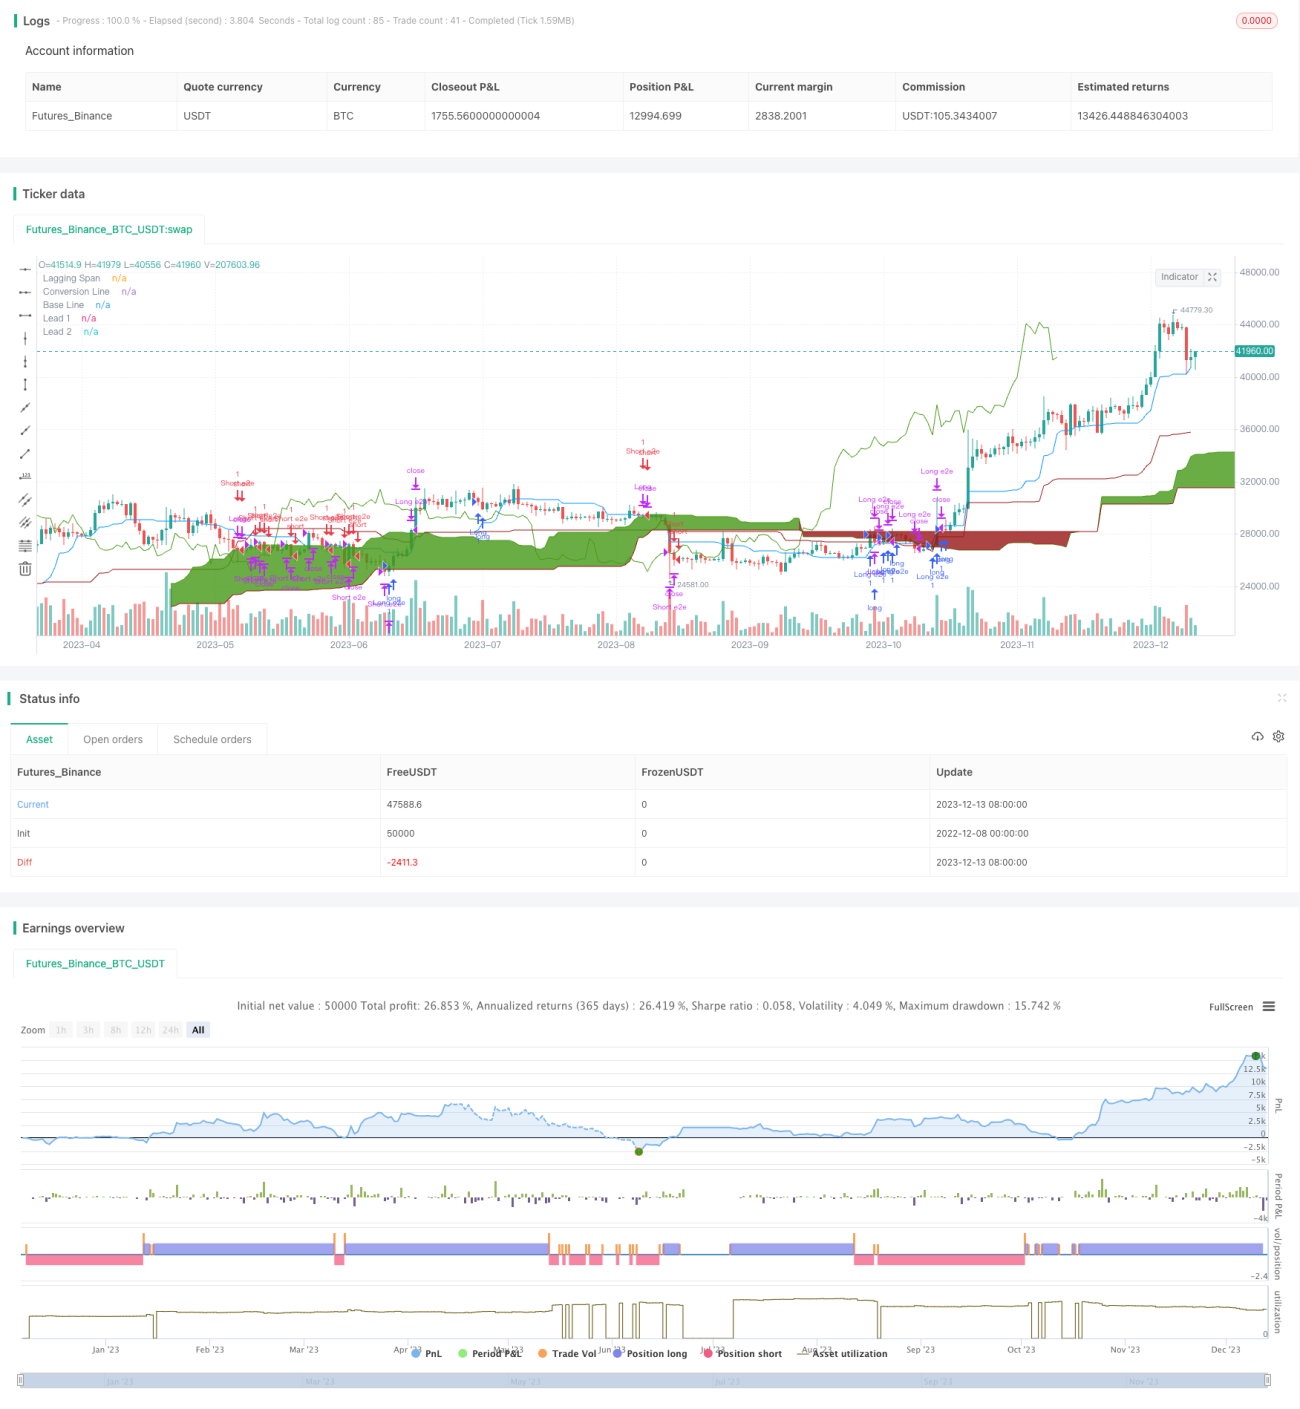
This trading strategy generates trading signals based on an indicator called Ichimoku Kinko Hyo. Ichimoku Kinko Hyo literally translates to “one glance equilibrium chart”. It combines the advantages of moving averages and band indicators to identify both trend direction and support/resistance levels, thus considered a comprehensive indicator.

The strategy utilizes Ichimoku’s component lines to determine trend direction and strength. Trading signals are generated when the price breaks through the top or bottom of the Cloud. Also, the strategy takes advantage of “edge-to-edge” entry opportunities unique to Ichimoku system.

Strategy Logic

The strategy employs five lines from the Ichimoku Kinko Hyo system:

  1. Tenkan Line: 9-period average of highest high and lowest low
  2. Kijun Line: 26-period average of highest high and lowest low
  3. Senkou Span A: average of Tenkan Line and Kijun Line
  4. Senkou Span B: 52-period average of highest high and lowest low
  5. Chikou Line: 26-period lagging moving average of close

The Cloud is the area between Senkou Span A and Senkou Span B, representing the current trend range generally.

Trading signals are generated based on the following scenarios:

  1. Price breaking above the top of the Cloud: long signal
  2. Price breaking below the bottom of the Cloud: short signal
  3. Price entering the Cloud from below: long edge-to-edge opportunity
  4. Price entering the Cloud from above: short edge-to-edge opportunity

In addition, the strategy uses Tenkan/Kijun cross to determine take profit and stop loss levels.

Advantages

The biggest strength of this strategy lies in Ichimoku’s ability to determine trend direction and support/resistance levels.

  1. The Cloud identifies major trend direction, avoiding trading against the trend.
  2. The component lines spot support/resistance levels to locate breakout opportunities.
  3. Edge-to-edge entry provides more profit potential.

Also, the strategy incorporates Tenkan/Kijun cross for partial profit taking and risk control.

Risks and Management

The main risk comes from potential gaps in Ichimoku lines causing false breakout.

Solutions include optimizing parameters to narrow down line intervals, or adding filters to avoid trading in ranging zones.

Optimization

Several aspects of the strategy can be improved:

  1. Optimize Ichimoku parameters and adjust moving average periods to suit more symbols and timeframes.

  2. Incorporate volume confirmation to avoid gaps causing false signals.

  3. Add other indicators such as MACD, RSI for extra trend and oscillator filters.

  4. Enhance stop loss and take profit rules, e.g. trailing stop, position sizing etc.

Summary

In summary, this Ichimoku system identifies trend direction and trading chances with the Cloud and component lines. The advantages lie in clear trend determination and accurate entry signals. Further improvements on parameters and filters can lower false signals for better strategy performance.


/*backtest
start: 2022-12-08 00:00:00
end: 2023-12-14 00:00:00
period: 1d
basePeriod: 1h
exchanges: [{"eid":"Futures_Binance","currency":"BTC_USDT"}]
*/

//@version=5
strategy("Ichimoku Cloud", shorttitle="Ichimoku", overlay=true)

previous_close = close[1]

conversionPeriods = input.int(20, minval=1, title="Conversion Line Periods"),
basePeriods = input.int(60, minval=1, title="Base Line Periods")
laggingSpan2Periods = input.int(120, minval=1, title="Lagging Span 2 Periods"),
displacement = input.int(30, minval=1, title="Displacement")

long_entry = input.bool(true, title="Long Entry")
short_entry = input.bool(true, title="Short Entry")
e2e_entry = input.bool(true, title="E2E Entry")

donchian(len) => math.avg(ta.lowest(len), ta.highest(len))

tenkan = donchian(conversionPeriods)
kijun = donchian(basePeriods)
spanA = math.avg(tenkan, kijun)
spanB = donchian(laggingSpan2Periods)

plot(tenkan, color=#0496ff, title="Conversion Line")
plot(kijun, color=#991515, title="Base Line")
plot(close, offset = -displacement, color=#459915, title="Lagging Span")

p1 = plot(spanA, offset = displacement, color=#459915, title="Lead 1")
p2 = plot(spanB, offset = displacement, color=#991515, title="Lead 2")
fill(p1, p2, color = spanA > spanB ? #459915 : #991515)

ss_high = math.max(spanA[displacement - 1], spanB[displacement - 1])
ss_low = math.min(spanA[displacement - 1], spanB[displacement - 1])

// Entry/Exit Signals
tk_cross_bull = tenkan > kijun
tk_cross_bear = tenkan < kijun
kumo_twist_bull = ta.mom(close, displacement) > 0
kumo_twist_bear = ta.mom(close, displacement) < 0

price_above_kumo = close > ss_high
price_below_kumo = close < ss_low

price_enters_kumo_top = previous_close > ss_high[1] and close < ss_high
price_enters_kumo_bottom = previous_close < ss_low[1] and close > ss_low

bullish = tk_cross_bull and kumo_twist_bull and price_above_kumo
bearish = tk_cross_bear and kumo_twist_bear and price_below_kumo

bullishe2e = price_enters_kumo_bottom // and tk_cross_bull
bearishe2e = price_enters_kumo_top // and tk_cross_bear

price_touches_kumo_top = ta.cross(close, ss_high)
price_touches_kumo_bottom = ta.cross(close, ss_low)

strategy.entry("Long", strategy.long, when=bullish and long_entry)
strategy.close("Long", when=tk_cross_bear)
strategy.close("Long", when=price_enters_kumo_top)

strategy.entry("Long e2e", strategy.long, when=bullishe2e and e2e_entry)
strategy.close("Long e2e", when=price_touches_kumo_top)
strategy.close("Long e2e", when=price_below_kumo, qty_percent = 100)
// strategy.close("Long e2e", when=ta.cross(close, kijun), qty_percent = 50)

strategy.entry("Short", strategy.short, when=bearish and short_entry)
strategy.close("Short", when=tk_cross_bull)
strategy.close("Short", when=price_enters_kumo_bottom)

strategy.entry("Short e2e", strategy.short, when=bearishe2e and e2e_entry)
strategy.close("Short e2e", when=price_touches_kumo_bottom)
strategy.close("Short e2e", when=price_above_kumo, qty_percent = 100)
// strategy.close("Long e2e", when=ta.cross(close, kijun), qty_percent = 50)


More