An Intraday Trend Following Quantitative Strategy Based on Multi-indicator Condition Filtering

Overview
This strategy combines PSAR to judge price trends, ADX to judge trend strength, RSI to locate overbought and oversold zones, and CMF to judge fund flows to construct an intraday trend-following quantitative trading strategy across cycles. It can quickly locate new trend directions when prices break out of consolidation and form new trends, and continues to track trends afterwards. While ensuring that main trend gains are captured, filtering conditions are also set during the process to reduce holding risks.
Principles
The main judging rules of this strategy are:
-
Use the PSAR indicator to judge whether prices are in an uptrend. PSAR’s decline below prices indicates the end of the upward trend and the start of a downward trend.
-
Require RSI to be above the midpoint of 50 to filter out false breakouts occurring in oversold zones.
-
Require ADX to be above its EMA line, indicating a sustainable signal in trend analysis.
-
Require CMF to be greater than 0, judging increased funds flowing in.
Buying signals are generated when all four conditions above are met. Selling conditions occur when PSAR rises above prices, RSI drops below 50, ADX drops below its EMA and CMF becomes less than 0.
This strategy comprehensively considers the price trend direction, trend strength, the overbought/oversold state and fund flows when setting up trading rules. By setting strict logical rules when generating trading signals, false breakouts can be effectively filtered and high probability sustainable trend directions can be captured.
Advantages
The main advantages of this strategy include:
-
Combining multiple indicators in setting up trading rules can effectively prevent false breakouts and ensures signal quality.
-
Rapidly locating budding trend directions and tracking enables capturing most trend profits.
-
Setting up process filtering conditions can effectively control risks and ensures tracking efficacy.
-
Considering trend strength helps avoiding trading range congestions.
Risk Analysis
The main risks of this strategy include:
-
A single strategy accumulation poses portfolio risks, requiring appropriate position sizing.
-
Closely monitor filtering condition changes during tracking to avoid losses when cancelled.
-
This mid/long-term strategy can be disrupted short-term by fluctuations and incurs stop loss risks.
Corresponding risk management measures include: optimizing position sizing rules, setting risk alert lines and widening stop distances etc.
Optimization Directions
Optimization spaces include:
-
Parameter optimization via machine learning given current subjective settings.
-
Add position sizing module that dynamically sizes based on risks.
-
Enhance stop mechanisms e.g. trailing stops, time stops or breakout stops.
Conclusion
This strategy combining indicators proved effective in rapidly locating and tracking nascent trends, validating quantitative trading based on multiple dimensions like trends and funds. As a base, it can be indexed across cycles. With parameter tuning and modular enhancements, it can also become a stable mid/long-term strategy.
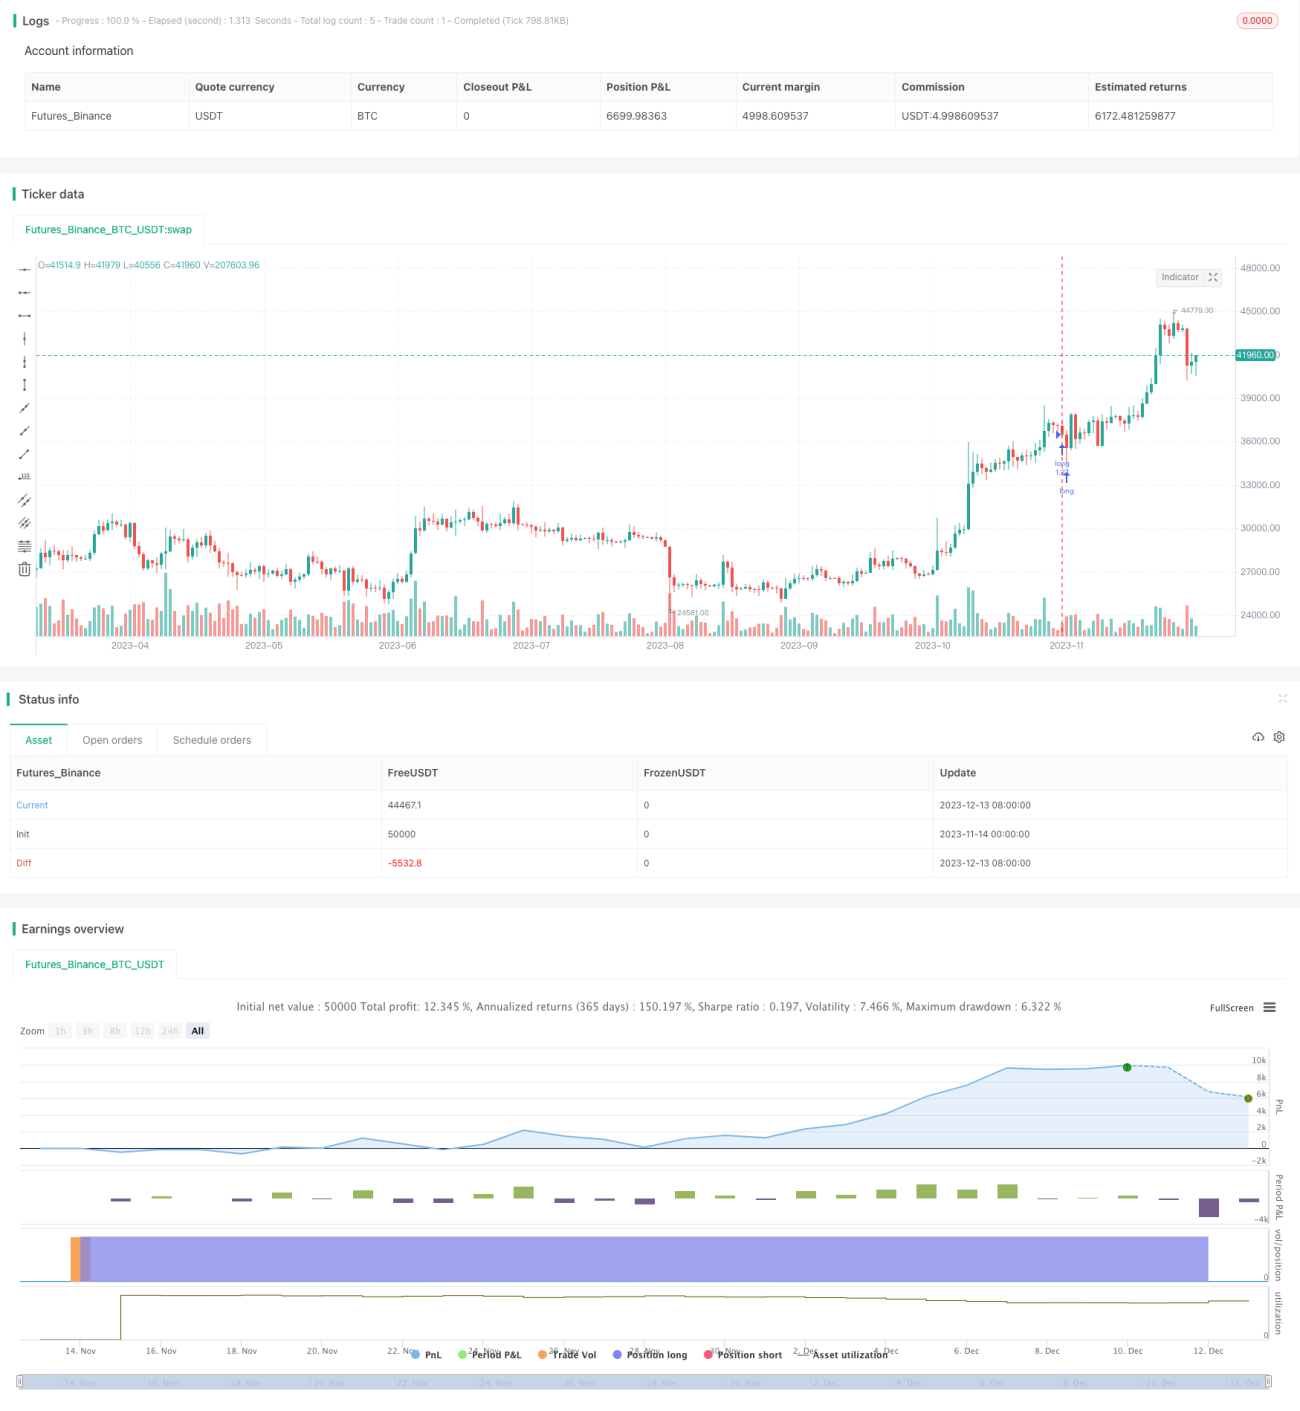
/*backtest
start: 2023-11-14 00:00:00
end: 2023-12-14 00:00:00
period: 1d
basePeriod: 1h
exchanges: [{"eid":"Futures_Binance","currency":"BTC_USDT"}]
*/

//@version=4
strategy("psar+ adx + cmf + rsi Strategy", overlay=true,initial_capital = 1000, default_qty_type=strategy.percent_of_equity, default_qty_value=100, commission_type=strategy.commission.percent , commission_value=0.1 )

start = input(1.02)- 1