Quantitative Trading Strategy Based on TRSI and SUPER Trend Indicators

Author: ChaoZhang, Date: 2023-12-15 16:05:51
Tags:

img

Overview

This strategy combines the Relative Strength Index (TRSI) and Super Trend indicators to form a relatively complete quantitative trading strategy. It is mainly used to capture medium-to-long-term trends, while using short-term indicators to filter out noise trading signals.

Strategy Logic

  1. Calculate the TRSI indicator to determine whether the market is in an overbought or oversold state, and issue buy and sell signals
  2. Use the Super Trend indicator to filter out noise signals and confirm the underlying trend
  3. Set stop loss and take profit points at different stages of profitable positions

Specifically, the strategy first calculates the TRSI indicator to judge whether the market has entered the overbought or oversold zone, and then calculates the Super Trend indicator to determine the major trend direction. Trading signals are issued by combining the two. Stop loss and take profit points are then set to withdraw different proportions of funds at different stages of profitability.

Advantage Analysis

This strategy has the following advantages:

  1. Multi-indicator combination improves signal accuracy. TRSI determines timing and Super Trend filters direction.
  2. Applicable to medium and long term trend trading. Overbought and oversold signals tend to form trend reversals.
  3. Stop loss and take profit settings are reasonable, withdrawing different proportions of funds at different profitability stages to effectively control risk.

Risk Analysis

This strategy also has some risks:

  1. Medium-to-long-term trading fails to capture short-term trading opportunities.
  2. Improper TRSI parameter settings may miss overbought and oversold zones.
  3. Improper Super Trend parameter settings may issue wrong signals.
  4. Excessively large stop loss space fails to effectively control risks.

To address these risks, we can optimize from the following aspects:

Optimization Directions

  1. Incorporate more short-term indicators to identify more trading opportunities.
  2. Adjust TRSI parameters to narrow the error interval.
  3. Test and optimize Super Trend parameters.
  4. Set floating stop losses to track stop loss lines in real time.

Summary

This strategy integrates multiple indicators such as TRSI and Super Trend to form a relatively complete quantitative trading strategy. It can effectively identify medium-to-long-term trends while setting stop loss and take profit to control risks. There is still much room for optimization, with subsequent improvements possible in areas like improving signal accuracy and identifying more trading opportunities. Overall, this is a good starting point for a quantitative strategy.
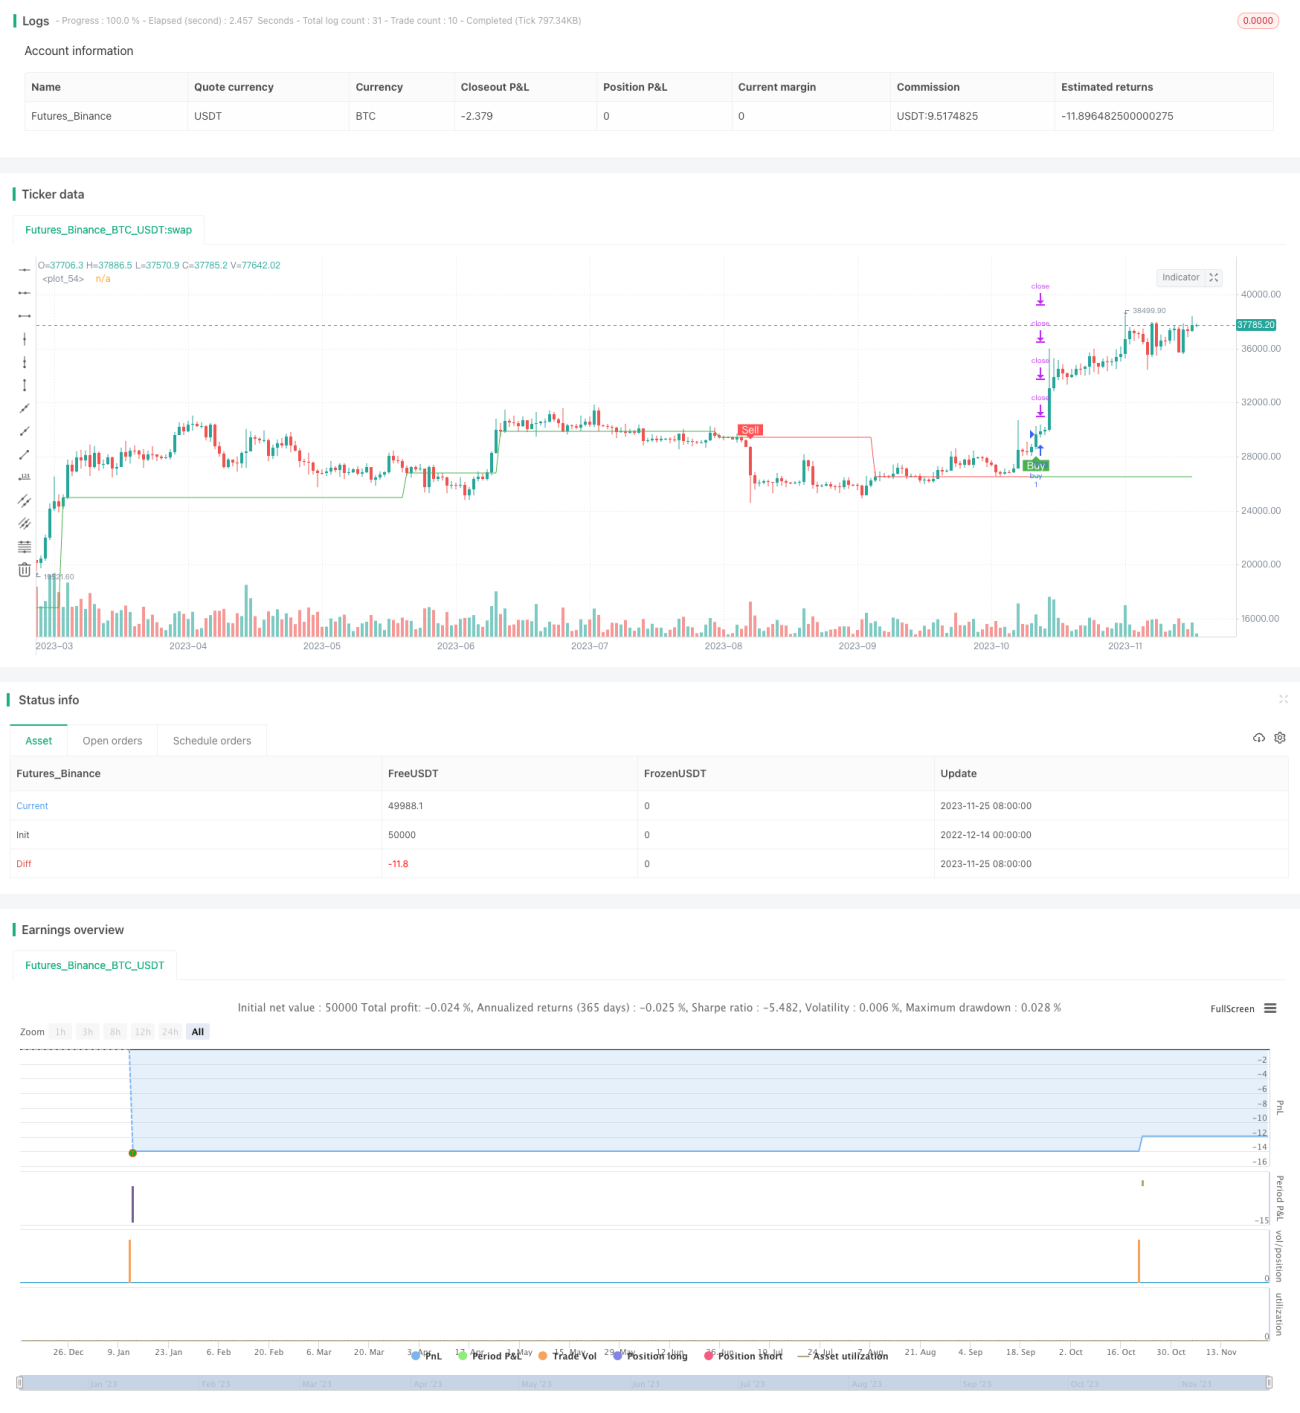

/*backtest
start: 2022-12-14 00:00:00
end: 2023-11-26 05:20:00
period: 1d
basePeriod: 1h
exchanges: [{"eid":"Futures_Binance","currency":"BTC_USDT"}]
*/


//@version=4
strategy(title = "SuperTREX strategy", overlay = true)
strat_dir_input = input(title="Strategy Direction", defval="long", options=["long", "short", "all"])
strat_dir_value = strat_dir_input == "long" ? strategy.direction.long : strat_dir_input == "short" ? strategy.direction.short : strategy.direction.all
strategy.risk.allow_entry_in(strat_dir_value)
length = input( 14 )
overSold = input( 35 )
overBought = input( 70 )
HTF = input("W", type=input.resolution)
ti = change( time(HTF) ) != 0
p = fixnan( ti ? close : na )

vrsi = rsi(p, length)
price = close
var bool long = na
var bool short = na

long :=crossover(vrsi,overSold) 
short := crossunder(vrsi,overBought)

var float last_open_long = na
var float last_open_short = na

last_open_long := long ? close : nz(last_open_long[1])
last_open_short := short ? close : nz(last_open_short[1])


entry_value =last_open_long
entry_value1=last_open_short

xy=(entry_value+entry_value)/2

// INPUTS //
st_mult   = input(4,   title = 'SuperTrend Multiplier', minval = 0, maxval = 100, step = 0.01)
st_period = input(10, title = 'SuperTrend Period',     minval = 1)

// CALCULATIONS //
up_lev =xy - (st_mult * atr(st_period))
dn_lev =xy + (st_mult * atr(st_period))

up_trend   = 0.0
up_trend   := entry_value[1] > up_trend[1]   ? max(up_lev, up_trend[1])   : up_lev

down_trend = 0.0
down_trend := entry_value1[1] < down_trend[1] ? min(dn_lev, down_trend[1]) : dn_lev

// Calculate trend var
trend = 0
trend := close > down_trend[1] ? 1: close < up_trend[1] ? -1 : nz(trend[1], 1)

// Calculate SuperTrend Line
st_line = trend ==1 ? up_trend : down_trend
plot(xy,color = trend == 1 ? color.green : color.red)

buy=crossover( close, st_line) 
sell1=crossunder(close, st_line) 


buy1=buy
//

sell=sell1


// STRATEGY

plotshape(buy , title="buy", text="Buy", color=color.green, style=shape.labelup, location=location.belowbar, size=size.small, textcolor=color.white, transp=0)  //plot for buy icon
plotshape(sell, title="sell", text="Sell", color=color.red, style=shape.labeldown, location=location.abovebar, size=size.small, textcolor=color.white, transp=0)  //plot for sell icon
// Take profit

//
l = buy 
s1=sell 
if l 
    strategy.entry("buy", strategy.long)
if s1 
    strategy.entry("sell", strategy.short)
per(pcnt) =>  strategy.position_size != 0 ? round(pcnt / 100 * strategy.position_avg_price / syminfo.mintick) : float(na)
stoploss=input(title=" stop loss", defval=25, minval=0.01)
los = per(stoploss)
q1=input(title=" qty_percent1", defval=25, minval=1)
q2=input(title=" qty_percent2", defval=25, minval=1)
q3=input(title=" qty_percent3", defval=25, minval=1)
tp1=input(title=" Take profit1", defval=2, minval=0.01)
tp2=input(title=" Take profit2", defval=4, minval=0.01)
tp3=input(title=" Take profit3", defval=6, minval=0.01)
tp4=input(title=" Take profit4", defval=8, minval=0.01)
strategy.exit("x1", qty_percent = q1, profit = per(tp1), loss = los)
strategy.exit("x2", qty_percent = q2, profit = per(tp2), loss = los)
strategy.exit("x3", qty_percent = q3, profit = per(tp3), loss = los)
strategy.exit("x4", profit = per(tp4), loss = los)


More