Dual Direction Price Breakthrough Moving Average Timing Trading Strategy

Author: ChaoZhang, Date: 2023-12-15 16:28:12
Tags:

img

Overview

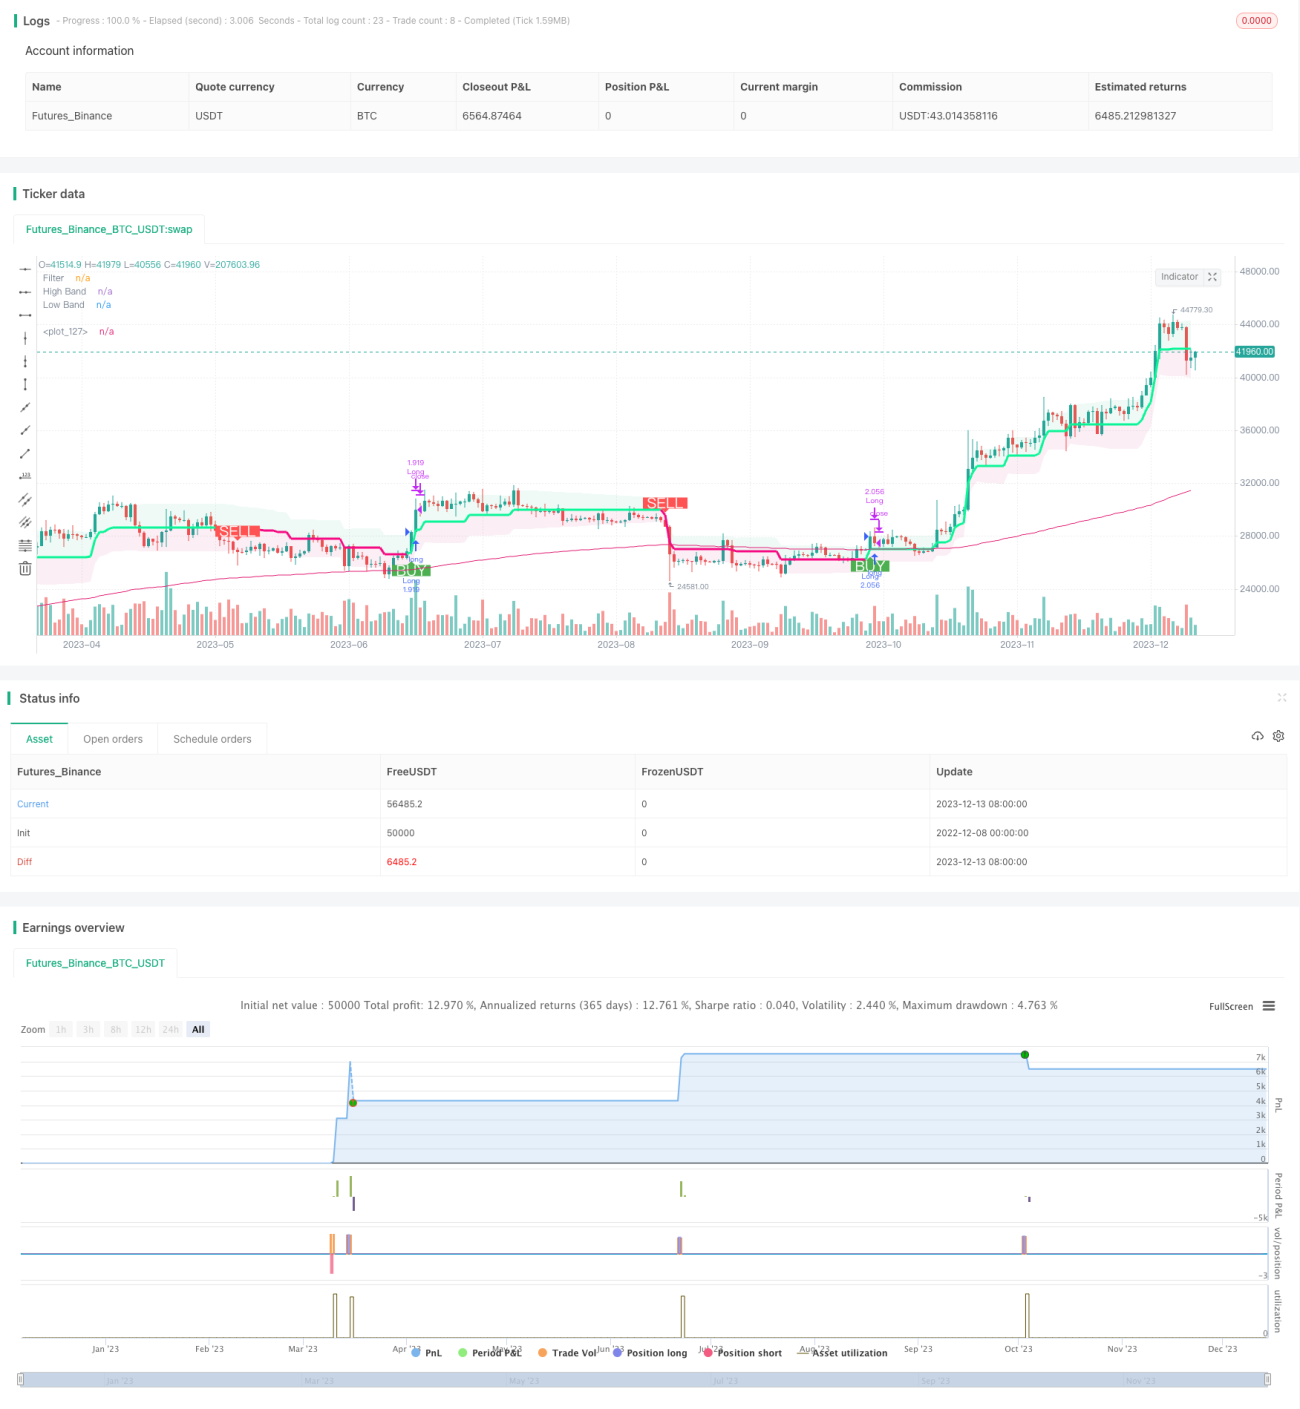
The Dual Direction Price Breakthrough Moving Average Timing Trading Strategy is a quantitative trading strategy that uses price breakthrough of moving averages to determine trading signals. It compares price with moving averages of specified periods and generates trading signals when price breaks through moving averages.

Strategy Logic

The core logic of this strategy is:

  1. Calculate moving averages (EMA) of specified period (e.g. 200 days) using EMA function.

  2. Compare close price with EMA to determine if price breaks through EMA. Specifically, when close price is above EMA, price breaks up through EMA; when close price is below EMA, price breaks down through EMA.

  3. Determine long and short signals based on breakthroughs. When price breaks up through EMA, generate long signal; when price breaks down through EMA, generate short signal.

  4. When signal is triggered, place order with certain percentage (e.g. 100%) and set stop loss and take profit prices.

  5. When stop loss or take profit price is touched, close position.

  6. Repeat the process to profit from timing of price breaking through moving averages.

The strategy is simple and straightforward to understand and implement. It aims to capture short-term momentum by signals of breaking through moving averages. But it also has certain lagging and whipsaw risks.

Advantages

  • Simple and clear logic, easy to understand and validate.
  • Smooth tracking ability utilizing characteristics of moving averages.
  • High trading frequency, suitable for short-term trading.
  • Quick response to price change, catching good timing.

Risks

  • Certain level of lagging, may miss initial breakthrough of price.
  • Frequent trading when whipsawed multiple times.
  • Risk of being stopped out on sharp reversals.

Optimization methods include parameter tuning, using more effective indicators, reducing trading frequency etc. Adaptive stops and filtering conditions can also control risks.

Optimization Directions

  • Test different types and parameters of moving averages for better solution, e.g. EMA, SMA, LWMA.
  • Add filtering conditions to avoid whipsaw trades, e.g. volume, Bollinger Bands, ATR etc.
  • Optimize and test stop loss and take profit strategies to lower risks.
  • Combine trend following, mean reversion and other strategies for robust trading system.
  • Add parametrization for wider adaptability.

Conclusion

The strategy has relatively simple logic of tracking moving averages to capture short-term momentum. Advantages include responsiveness and ease of use; disadvantages include lagging and inertia. Further optimizations can be done on indicator selection, stop loss mechanisms, filtering techniques to make the strategy more solid and comprehensive.


/*backtest
start: 2022-12-08 00:00:00
end: 2023-12-14 00:00:00
period: 1d
basePeriod: 1h
exchanges: [{"eid":"Futures_Binance","currency":"BTC_USDT"}]
*/

// This source code is subject to the terms of the Mozilla Public License 2.0 at https://mozilla.org/MPL/2.0/

// Credits to the original Script - Range Filter DonovanWall https://www.tradingview.com/script/lut7sBgG-Range-Filter-DW/
// This version is the old version of the Range Filter with less settings to tinker with

//@version=5
strategy(title='Range Filter - B&S Signals', shorttitle='RF - B&S Signals', initial_capital=1000, currency=currency.GBP, default_qty_value=100, default_qty_type=strategy.percent_of_equity, commission_type=strategy.commission.percent, commission_value=0.075, overlay=true)


i_startTime = input(defval=timestamp('01 Jan 2020 12:00 +0000'), title='Backtest Start')
i_endTime = input(defval=timestamp('01 Jan 2024 12:00 +0000'), title='Backtest End')

inDateRange     = true
//-----------------------------------------------------------------------------------------------------------------------------------------------------------------
//Functions
//-----------------------------------------------------------------------------------------------------------------------------------------------------------------
longLossPerc = input.float(title='Long Stop Loss (%)', minval=0.0, step=0.1, defval=1) * 0.01
shortLossPerc = input.float(title='Short Stop Loss (%)', minval=0.0, step=0.1, defval=1) * 0.01

longTakePerc = input.float(title='Long Take(%)', minval=0.0, step=0.1, defval=1) * 0.01
shortTakePerc = input.float(title='Short Take (%)', minval=0.0, step=0.1, defval=1) * 0.01

emaLength = input.int(200, title="EMA Length")

    // Determine stop loss price

//Range Size Function
rng_size(x, qty, n) =>
//    AC       = Cond_EMA(abs(x - x[1]), 1, n)
    wper = n * 2 - 1
    avrng = ta.ema(math.abs(x - x[1]), n)
    AC = ta.ema(avrng, wper) * qty
    rng_size = AC
    rng_size

//Range Filter Function
rng_filt(x, rng_, n) =>
    r = rng_
    var rfilt = array.new_float(2, x)
    array.set(rfilt, 1, array.get(rfilt, 0))
    if x - r > array.get(rfilt, 1)
        array.set(rfilt, 0, x - r)
    if x + r < array.get(rfilt, 1)
        array.set(rfilt, 0, x + r)
    rng_filt1 = array.get(rfilt, 0)

    hi_band = rng_filt1 + r
    lo_band = rng_filt1 - r
    rng_filt = rng_filt1
    [hi_band, lo_band, rng_filt]

//-----------------------------------------------------------------------------------------------------------------------------------------------------------------
//Inputs
//-----------------------------------------------------------------------------------------------------------------------------------------------------------------

//Range Source
rng_src = input(defval=close, title='Swing Source')

//Range Period
rng_per = input.int(defval=20, minval=1, title='Swing Period')

//Range Size Inputs
rng_qty = input.float(defval=3.5, minval=0.0000001, title='Swing Multiplier')

//Bar Colors
use_barcolor = input(defval=false, title='Bar Colors On/Off')

//-----------------------------------------------------------------------------------------------------------------------------------------------------------------
//Definitions
//-----------------------------------------------------------------------------------------------------------------------------------------------------------------

//Range Filter Values
[h_band, l_band, filt] = rng_filt(rng_src, rng_size(rng_src, rng_qty, rng_per), rng_per)

//Direction Conditions
var fdir = 0.0
fdir := filt > filt[1] ? 1 : filt < filt[1] ? -1 : fdir
upward = fdir == 1 ? 1 : 0
downward = fdir == -1 ? 1 : 0

//Trading Condition
longCond = rng_src > filt and rng_src > rng_src[1] and upward > 0 or rng_src > filt and rng_src < rng_src[1] and upward > 0
shortCond = rng_src < filt and rng_src < rng_src[1] and downward > 0 or rng_src < filt and rng_src > rng_src[1] and downward > 0

CondIni = 0
CondIni := longCond ? 1 : shortCond ? -1 : CondIni[1]
longCondition = longCond and CondIni[1] == -1
shortCondition = shortCond and CondIni[1] == 1

//Colors
filt_color = upward ? #05ff9b : downward ? #ff0583 : #cccccc
bar_color = upward and rng_src > filt ? rng_src > rng_src[1] ? #05ff9b : #00b36b : downward and rng_src < filt ? rng_src < rng_src[1] ? #ff0583 : #b8005d : #cccccc


ema = ta.ema(close,emaLength)

//-----------------------------------------------------------------------------------------------------------------------------------------------------------------
//Outputs
//-----------------------------------------------------------------------------------------------------------------------------------------------------------------
longStopPrice = strategy.position_avg_price * (1 - longLossPerc)
shortStopPrice = strategy.position_avg_price * (1 + shortLossPerc)

longTakePrice = strategy.position_avg_price * (1 + longTakePerc)
shortTakePrice = strategy.position_avg_price * (1 - shortTakePerc)

//Filter Plot
filt_plot = plot(filt, color=filt_color, linewidth=3, title='Filter', transp=67)

//Band Plots
h_band_plot = plot(h_band, color=color.new(#05ff9b, 100), title='High Band')
l_band_plot = plot(l_band, color=color.new(#ff0583, 100), title='Low Band')

//Band Fills
fill(h_band_plot, filt_plot, color=color.new(#00b36b, 92), title='High Band Fill')
fill(l_band_plot, filt_plot, color=color.new(#b8005d, 92), title='Low Band Fill')

//Bar Color
barcolor(use_barcolor ? bar_color : na)

if  inDateRange and close>ema
    strategy.entry("Long", strategy.long, when=longCondition)
    
if   inDateRange and close<ema
    strategy.entry("Short", strategy.short, when=shortCondition)


plot(ema)


//Plot Buy and Sell Labels
plotshape(longCondition, title='Buy Signal', text='BUY', textcolor=color.white, style=shape.labelup, size=size.normal, location=location.belowbar, color=color.new(color.green, 0))
plotshape(shortCondition, title='Sell Signal', text='SELL', textcolor=color.white, style=shape.labeldown, size=size.normal, location=location.abovebar, color=color.new(color.red, 0))

//Alerts
alertcondition(longCondition, title='Buy Alert', message='BUY')
alertcondition(shortCondition, title='Sell Alert', message='SELL')

if strategy.position_size > 0
    strategy.exit(id='Long', stop=longStopPrice, limit=longTakePrice)

if strategy.position_size < 0
    strategy.exit(id='Short', stop=shortStopPrice, limit=shortTakePrice)


More