Dual Moving Average Reversal Strategy

Overview
This is a short-term trading strategy that utilizes dual moving averages to determine market reversals. It judges the current uptrend or downtrend by examining the closing relationship of the previous three candlestick bars. When a trend reversal is detected, appropriate long or short positions are taken. Meanwhile, the strategy also uses a simple moving average to filter short signals and reduce trading risk.
Strategy Principle
The main judging indicator of this strategy is the closing price relationship of the previous three candlestick bars. If the previous three bars are all black candles, it is judged that the current is in a downward trend; if the previous three bars are all white candles, it is judged that the current is in an upward trend. When a large white candle appears after a downward trend, go long; when a large black candle appears after an upward trend, go short.
The specific judgment logic for going long is: if the previous three candlestick bars are all black candles, and the last candlestick bar is a large black candle, then go long. The closing logic is to close the position when the price breaks through the highest point of the previous candlestick bar.
The specific judgment logic for going short is: if the previous three candlestick bars are all white candles, and the last candlestick bar is a large white candle, and the price is below the simple moving average, then go short. The closing logic is to close the position when the price breaks through the lowest point of the previous candlestick bar.
The length of the moving average and the magnitude to judge large white and black candles are set by user input.
Advantages of the Strategy
-
Use candlestick patterns to determine market reversal points, avoid chasing each other in the trend, and reduce losses.
-
Combine the moving average to filter signals and avoid going short prematurely during the target rally.
-
The strategy logic is simple and clear, easy to understand and modify.
-
Customizable parameters suit different varieties and time cycles.
-
In certain conditions, it is beneficial to capture short-term adjustment opportunities in a timely manner.
Risks of the Strategy
-
The market may have consecutive three large black or white candles forming a false reversal, causing losses if taking positions. Set stricter reversal criteria to reduce this risk.
-
Failure to reverse will likely result in being chased by the trend. Set stop loss points to control risk.
-
Improper parameter settings may lead to over-trading or missing opportunities. Parameters need repeated testing and optimization.
-
It is easy to be trapped when the broader market fluctuates greatly. Raise white/black candle determination standards to avoid misjudgment.
Optimization of the Strategy
-
Use more complex indicators combined with candlestick patterns to determine reversal, such as BOLL, MACD, etc. to improve judgment accuracy.
-
Add trading volume or volatility indicators combined with candlestick patterns to avoid volume shortages.
-
Add stop loss logic. Set fixed point or tracking stop loss.
-
Optimize parameters to find the best parameter combination.
-
Test more varieties and cycle data to find the optimal application environment.
Summary
In general, this strategy is a relatively universal short-term strategy that captures short-term market reversals using simple indicators. Its advantages are easy to understand, clear logic, and good results through some optimization. But there are also some typical reversal strategy risks that need means like stop loss, strict reverse criteria, etc. to control. It can serve as a introductory strategy for quantitative trading to learn and practice.
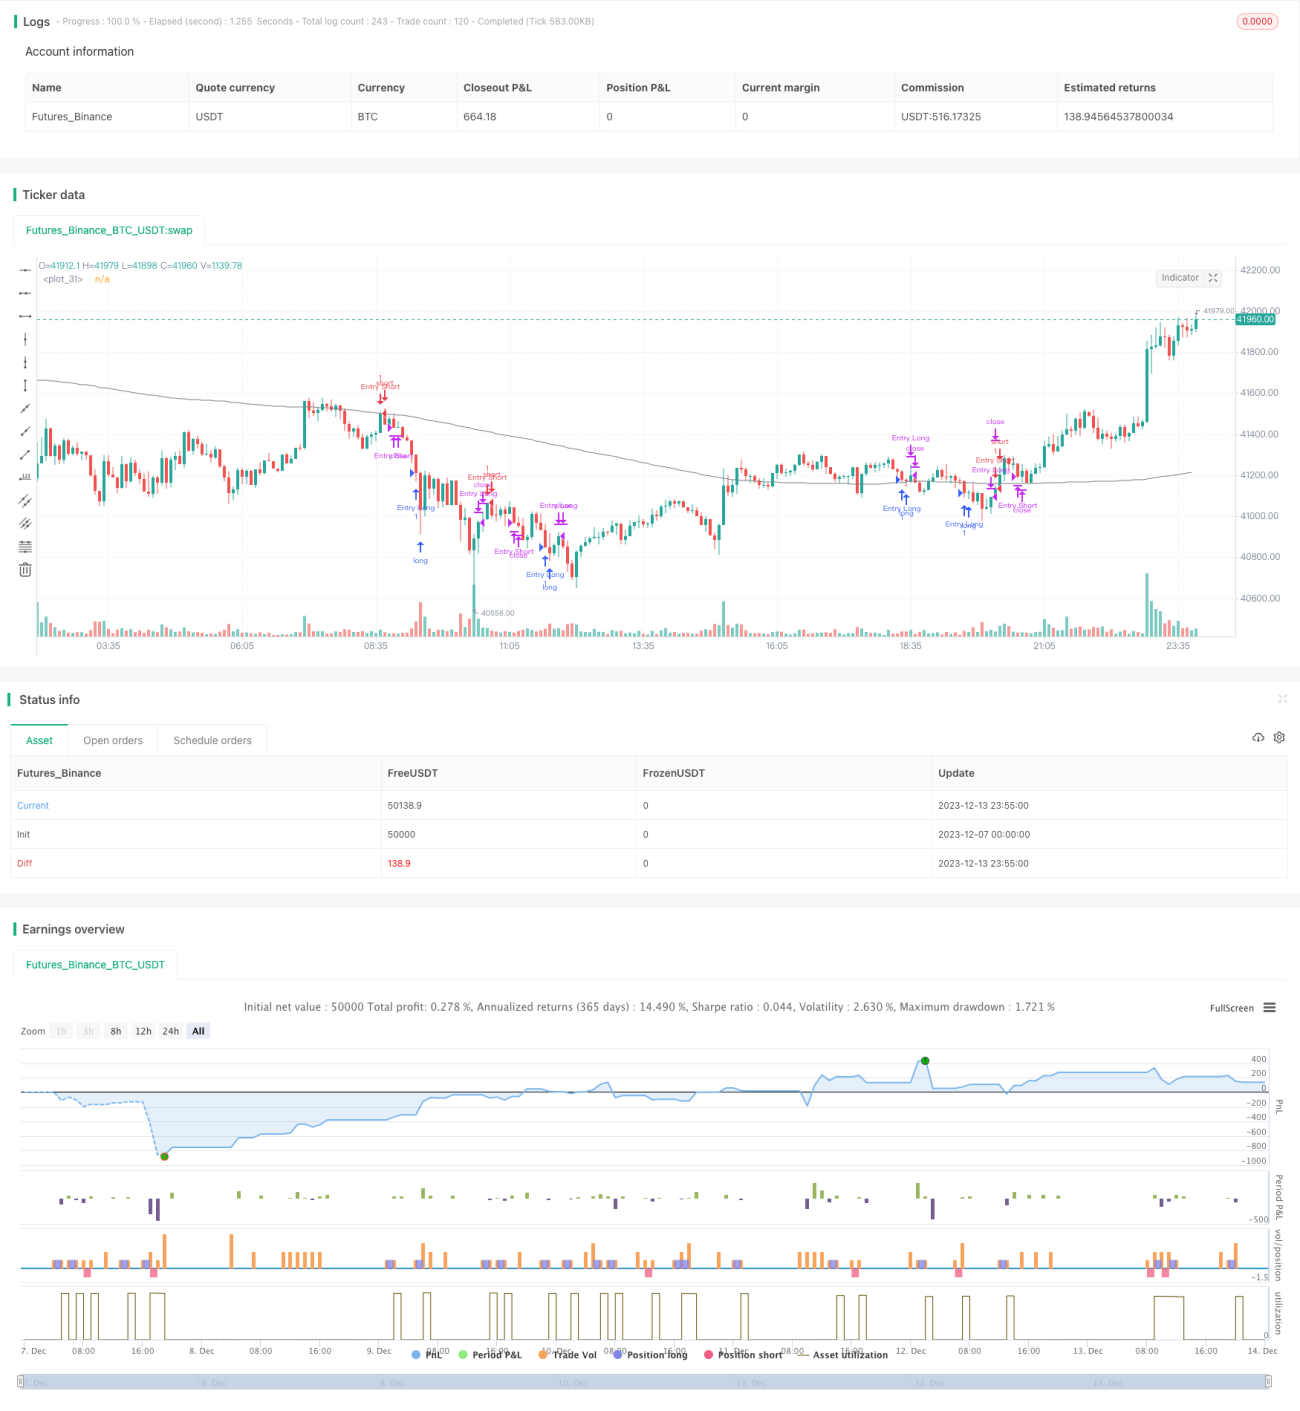
/*backtest
start: 2023-12-07 00:00:00
end: 2023-12-14 00:00:00
period: 5m
basePeriod: 1m
exchanges: [{"eid":"Futures_Binance","currency":"BTC_USDT"}]
*/

// This source code is subject to the terms of the Mozilla Public License 2.0 at https://mozilla.org/MPL/2.0/
// © stormis
// Based on strategy by hackertrader (original idea by QuantpT)
- 1