Momentum Breakout Bi-directional Tracking Strategy

Overview
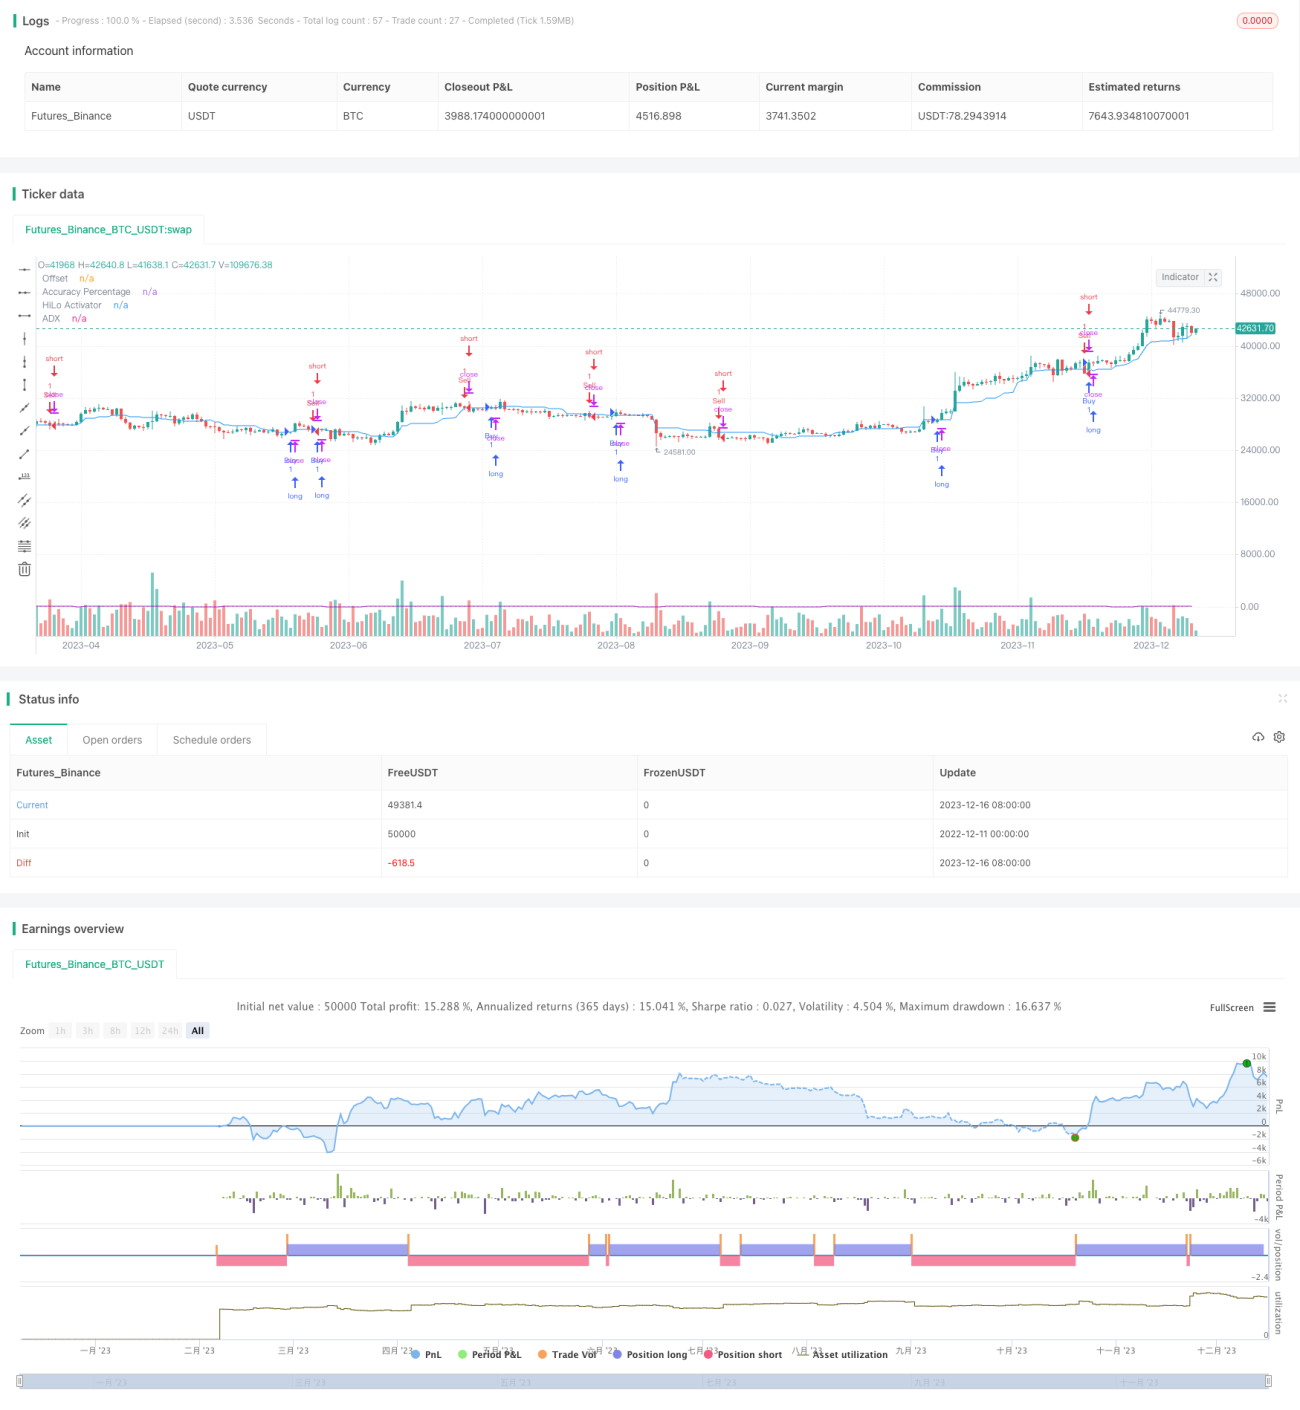
This strategy combines momentum indicators and bi-directional tracking indicators to capture breakout signals in strong trends for trend tracking. It goes long when prices break out upwards and goes short when prices break downwards. It belongs to the trend tracking strategy category.
Strategy Logic
-
The HiLo Activator indicator calculates the midpoint price using the midpoint of the highest high and lowest low. When prices break out above the midpoint, a buy signal is generated. When prices break down below the midpoint, a sell signal is generated.
-
The Average Directional Index (ADX) is used to gauge the strength of the trend. The higher the ADX value, the stronger the trend. This strategy uses ADX with a threshold to filter signals, only generating signals when the trend is strong enough.
-
The Directional Indicators DI+ and DI- represent the strength of the uptrend and downtrend respectively. This strategy also uses DI+ and DI- thresholds to confirm the strength to avoid wrong signals.
-
Buy signals are generated when prices break out above the midpoint, ADX is higher than the threshold, and DI+ is higher than the threshold. Sell signals are generated when prices break down below the midpoint, ADX is higher than the threshold, and DI- is higher than the threshold.
Advantage Analysis
This strategy combines the advantages of momentum and trend-following indicators to capture early breakouts and follow trends closely. The strict trend filter conditions also help avoid wrong signals in consolidation and ranging periods.
Compared to using momentum indicators alone, this strategy adds trend strength evaluation to filter signals and improve profitability. Compared to pure trend-following strategies, this strategy can enter trends earlier through breakout signals.
Overall, the strategy can track trends smoothly, enter and exit timely, and avoid being stuck in consolidations while also reducing losses from trend reversals.
Risk Analysis
This strategy has some whipsaw risks from temporary price reversals generating wrong signals. Also, using ADX and DI thresholds may cause missing some early opportunities.
To reduce whipsaw risks, tweak the HiLo Activator parameters to increase the breakout range. To capture more opportunities, lower the ADX and DI thresholds at the expense of signal quality.
Users should also note differences across products and market environments. Higher thresholds generally work better for commodities while lower thresholds suit stocks and forex.
Optimization Directions
The main ways to optimize this strategy include:
-
Adjust the HiLo Activator period and trigger levels to balance whipsaw risks and timing.
-
Tweak ADX period and threshold to balance signal quality and frequency.
-
Set separate thresholds for DI+ and DI- to accommodate differences between uptrends and downtrends.
-
Add stop loss strategies with stop loss levels to control single trade loss.
-
Combine with other auxiliary indicators to improve overall stability.
Conclusion
This strategy considers both momentum and trend-following indicators to generate signals during strong trends. It has the advantage of following trends smoothly and closely, suitable for capturing early trend opportunities. It also has reasonable risk control abilities to reduce losses from wrong signals and whipsaws. With parameter tuning and stop loss additions, it can achieve steady performance. As a versatile trend tracking strategy fitting different products and markets, it deserves good attention and application from quant traders.
- 1