Quantitative Trading Strategy Based on Double EMA and Price Volatility Index

Overview
This strategy is called "Moving Average Indicator and Price Volatility Combination Strategy". It combines the double exponential moving average (DEMA) and the price volatility index to generate a comprehensive trading signal.
Principle
The strategy consists of two parts:
-
DEMA indicator. This indicator calculates the 20-day and 2-day exponential moving averages. It generates trading signals when the price breaks through the 2-day line from above or breaks through the 20-day line from below.
-
(Highest Price - Lowest Price)/Close Price Volatility Index. This index reflects the fluctuation range of prices within one period. Here we calculate the 16-day simple moving average of the volatility index over the past 20 bars. When the current bar's volatility is higher or lower than this average value, it generates trading signals.
The signals from the two parts are combined. If DEMA and volatility index give signals at the same time, the final long or short trading orders will be generated.
Advantage Analysis
The strategy has the following advantages:
-
Combining multiple indicators can reduce false signals and improve signal reliability.
-
The 20-day line can effectively identify medium-to-long term trends, and the 2-day line can capture short-term fluctuations, making the combination adaptable to different market environments.
-
The volatility index can effectively reflect market volatility and trading opportunities.
-
By adjusting parameters, it can adapt to different products and cycle markets.
Risk Analysis
The strategy also has some risks:
-
In low volatility trends, the volatility index may generate wrong signals. Filtering with other liquidity indicators may help.
-
In rapid one-way markets, double EMAs may lag. Shortening parameters appropriately or combining with other indicators may help.
-
The increased complexity of multiple indicators also increases the risk of over-optimization. Comprehensive backtesting and parameter stability testing are required.
Optimization Directions
The strategy can also be optimized in the following aspects:
-
Adding stop loss mechanisms can effectively control per order loss.
-
Optimize parameters for different products and cycles to improve adaptability.
-
Increasing liquidity and volatility indicators to improve signal quality.
-
Adding machine learning algorithms to achieve dynamic parameter and weight adjustment.
Conclusion
By combining double EMAs and volatility indexes, this strategy can achieve good trading performance in both trending and volatile markets. There are also certain risks that require further optimization and improvement. But overall, the strategy idea is clear and has practical value.
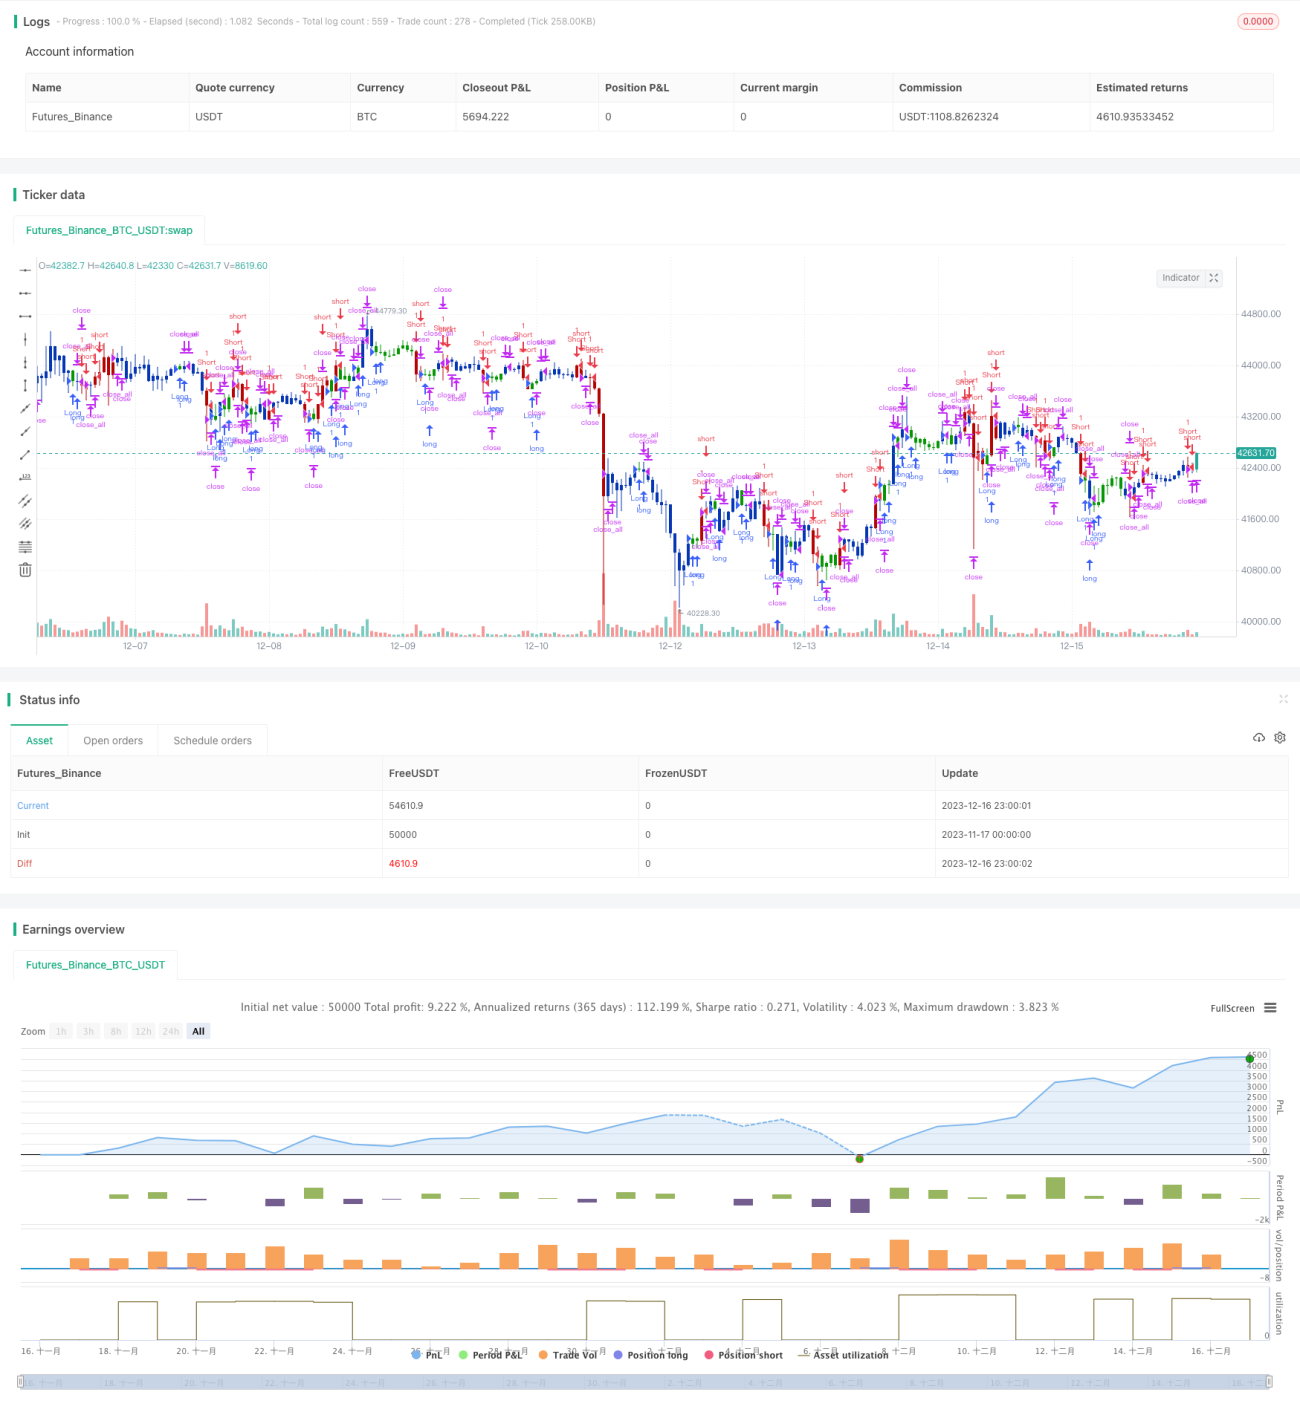
/*backtest
start: 2023-11-17 00:00:00
end: 2023-12-17 00:00:00
period: 1h
basePeriod: 15m
exchanges: [{"eid":"Futures_Binance","currency":"BTC_USDT"}]
*/

//@version=5
////////////////////////////////////////////////////////////
//  Copyright by HPotter v1.0 12/04/2022
// This is combo strategies for get a cumulative signal. - 1