Low Volatility Directional Buy with Profit Taking and Stop Loss

Overview
The strategy is named "Low Volatility Directional Buy with Profit Taking and Stop Loss". It utilizes moving average crossover as buy signals and combines profit taking and stop loss to lock in profit. It is suitable for low volatility coins.
Strategy Logic
The strategy uses 3 moving averages with different periods: 50-period, 100-period and 200-period. The buy logic is: when 50-period MA crosses over 100-period MA and 100-period MA crosses over 200-period MA, go long.
This signals a breakout from low volatility range and the start of a trend. 50-period MA's fast rise represents strengthening of short term momentum; 100-period MA also turning up indicates mid term force joining in to stabilize the up trend.
After entry, the strategy uses profit taking and stop loss to lock in gains. Take profit is set at 8% of entry price. Stop loss is set at 4% of entry price. With higher take profit over stop loss, it ensures the strategy stays profitable overall.
Advantage Analysis
The advantages of this strategy:
- Accurately capture trend opportunity from low volatility breakouts.
- Simple and clear logic with moving averages that are easy to calculate and backtest.
- Reasonable profit taking and stop loss settings ensure stable gains.
- Flexible configurable parameters make optimizations easy.
Risk Analysis
There are also some risks:
- Wrong breakout signals may cause losses.
- Hard to stop loss when markets reverse.
- Improper profit taking and stop loss parameter settings affect profitability.
Solutions:
- Add other indicators to filter signals and ensure breakout validity.
- Shorten stop loss period to reduce losses from reversals.
- Test different profit taking and stop loss ratios to find optimum.
Optimization Directions
Optimizations can be made in below areas:
- Test different moving average periods to find best combination.
- Add volume etc. to confirm trend breakouts.
- Dynamically adjust profit taking and stop loss percentage.
- Incorporate machine learning etc. to predict breakout success rate.
- Adjust parameters based on different market conditions and coins.
In summary, the strategy has clear logic overall, obtains low risk profit through configuring moving average periods and profit taking/stop loss percentage. It can be flexibly applied in quantitative trading. Further optimizations can be made in areas like entry signals and stop loss methods, combined with parameter tuning to achieve best results.
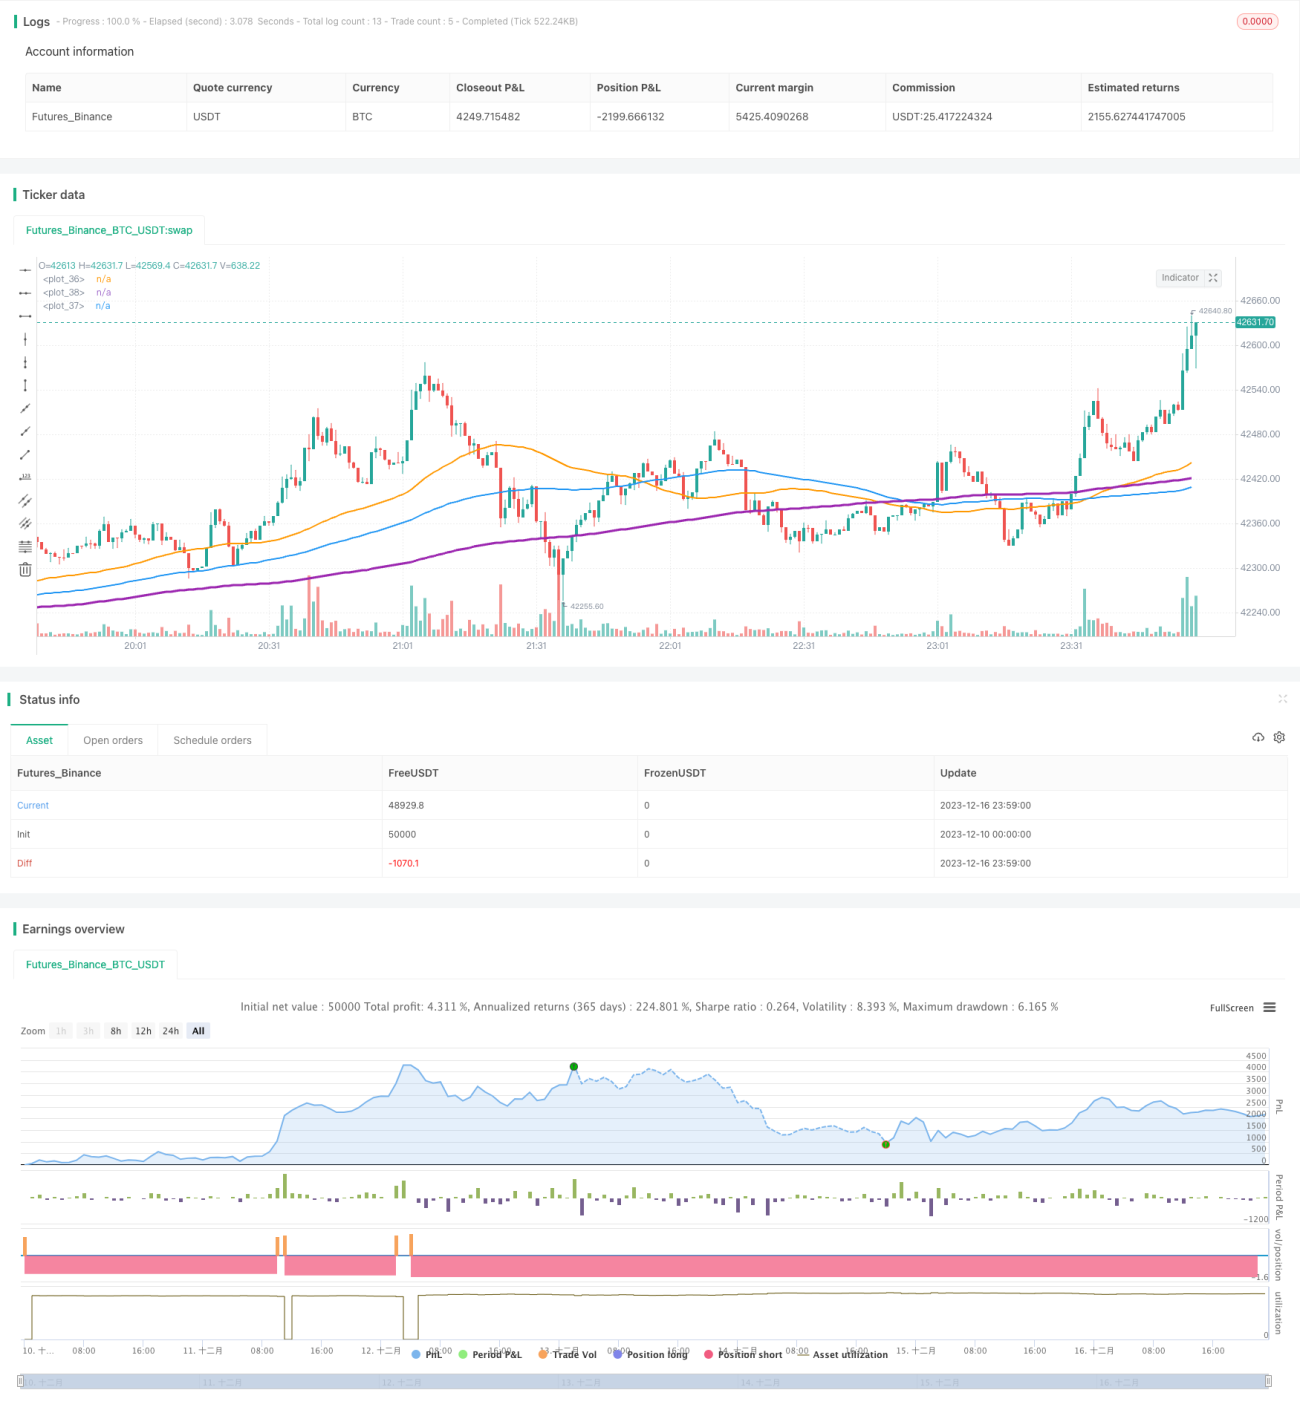
/*backtest
start: 2023-12-10 00:00:00
end: 2023-12-17 00:00:00
period: 1m
basePeriod: 1m
exchanges: [{"eid":"Futures_Binance","currency":"BTC_USDT"}]
*/

//@version=4
strategy(shorttitle='Low volatility Buy w/ TP & SL (by Coinrule)',title='Low volatility Buy w/ TP & SL', overlay=true, initial_capital = 1000, process_orders_on_close=true, default_qty_type = strategy.percent_of_equity, default_qty_value = 100)

//Backtest dates- 1