Galileo Galilei's Moving Average Crossover Strategy

Overview
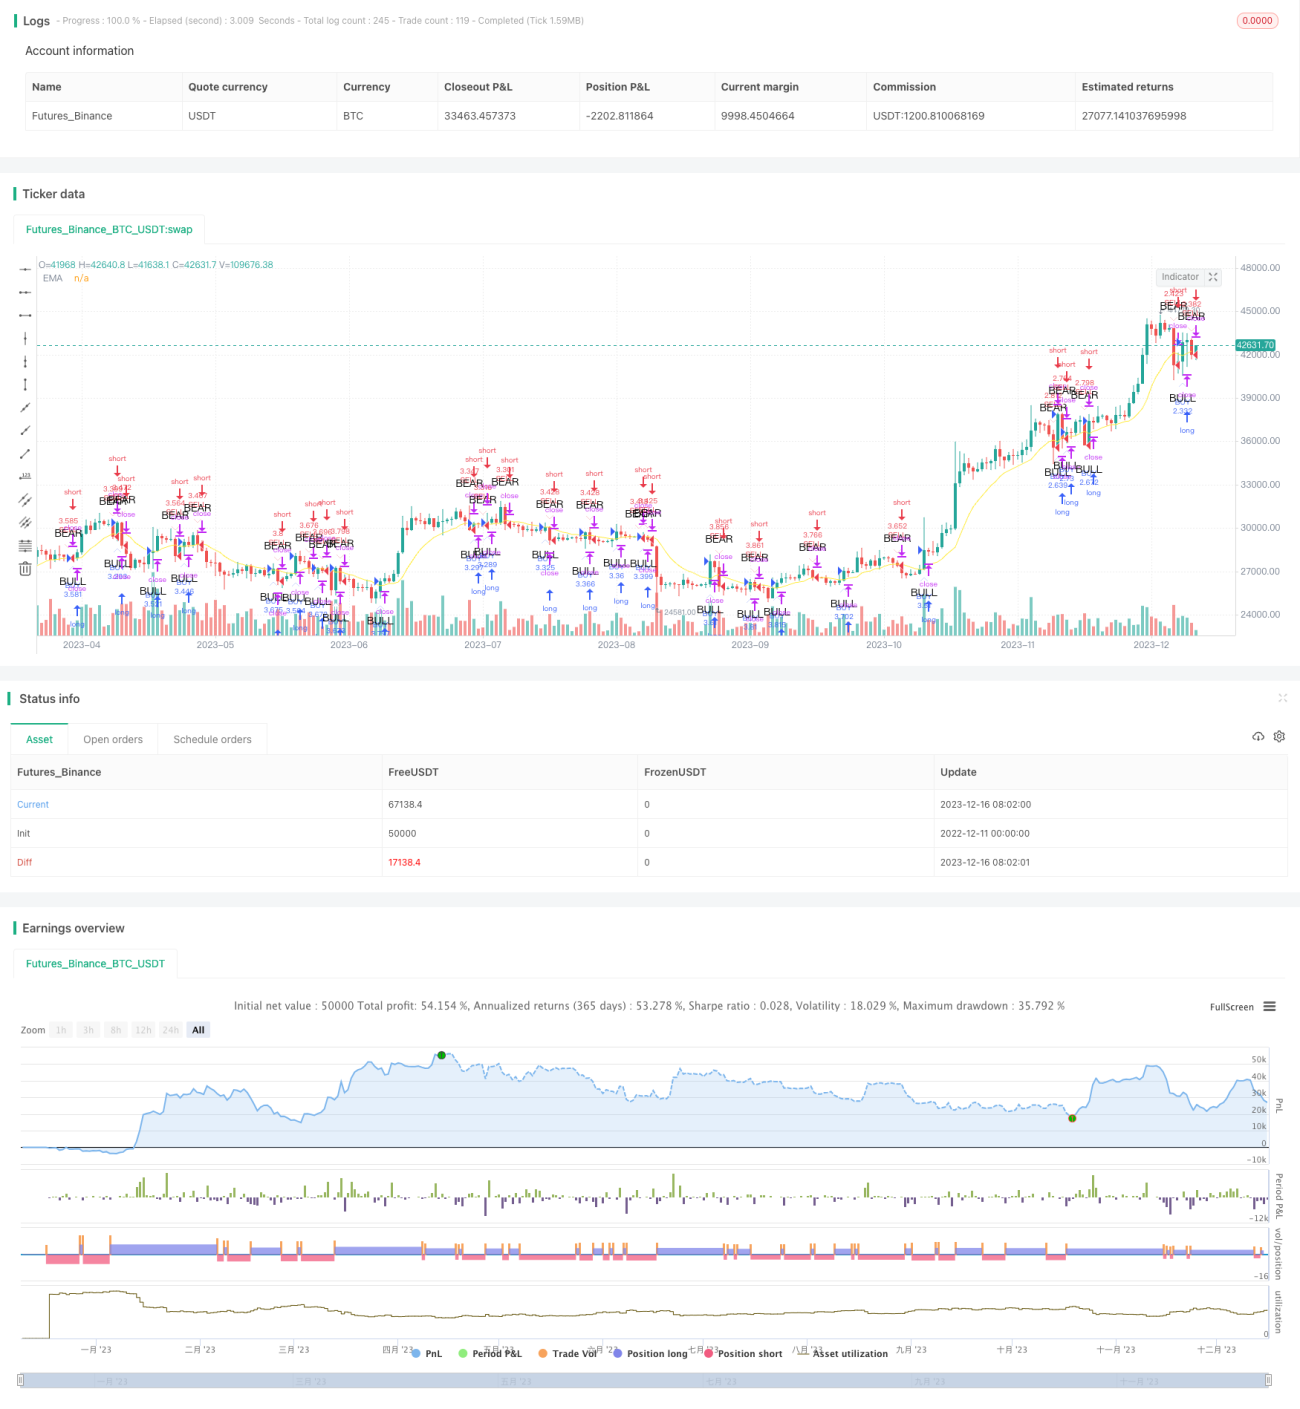
Galileo Galilei's moving average crossover strategy is a trading strategy based on moving averages. It generates trading signals by calculating the exponential moving average (EMA) over a specified period and comparing crossovers between the EMA and price. Sell signals are generated when the price drops below the EMA from the top down, while buy signals occur when the price breaks above the EMA from the bottom up.
Strategy Logic
The core of Galileo Galilei's strategy lies in the exponential moving average (EMA). EMA is a type of moving average that places more weight on recent prices. Its calculation formula is:
EMA today = (Closing price today × Smoothing factor) + (EMA yesterday × (1 − Smoothing factor))
Where the smoothing factor α = (2/(number of periods + 1))
The strategy dynamically calculates the EMA based on user input period parameters. It then compares the crossovers between price and EMA to determine trading signals:
-
When price drops below the EMA from the top down, a sell signal is generated for short trading.
-
When price breaks above the EMA from below, a buy signal is triggered for long trading.
The strategy also plots the EMA line on the chart, along with arrow markers indicating buy and sell signals.
Advantage Analysis
Galileo Galilei's moving average crossover strategy has the following advantages:
- Simple logic that is easy to understand and implement, suitable for beginners.
- Faster response to price changes through the use of EMA.
- Clear crossover signals without excessive whipsaws.
- Flexibility to adapt to different market environments by adjusting EMA parameters.
- Defined entry and exit signals provide risk control.
Risk Analysis
Potential risks of this strategy include:
- More false signals may occur during high price volatility. A stop loss strategy could help optimize.
- Reliance on a single indicator makes it vulnerable to price manipulation. Additional indicators may improve robustness.
- Lagging effect, especially after sudden events. Shortening EMA periods could help.
- Unable to adapt to prolonged one-sided price trends, a common limitation among moving average strategies.
Optimization Directions
Some ways to optimize the strategy:
-
Incorporate other indicators to construct a composite strategy for increased robustness against false signals. Examples include volume, trend indicators etc.
-
Add stop loss mechanisms like trailing stop loss or percentage-based stop loss to control single-trade loss amount.
-
Test EMAs with different parameter combinations to find optimal settings. Other moving average types could also be evaluated.
-
Assess re-entry logic to capture rebounds after initial price reversals, improving profitability.
Conclusion
Galileo Galilei's moving average crossover is a simple yet practical strategy with clear logic and easy operability. It is suitable for novice quant traders. With continuous improvements, its performance could become increasingly superior over time.
- 1