Heikin-Ashi - 0.5% Change Short Period Trading Strategy

Overview
This is a short-term trading strategy that issues buy and sell signals based on 0.5% changes in the Heikin-Ashi close price. It is only suitable for Heikin-Ashi candlestick charts and works best at periods of 2 hours, 1 hour, and 30 minutes.
Strategy Logic
The core logic of this strategy is: Go long when the Heikin-Ashi close price rises 0.5% compared to the previous candlestick; Go short when the Heikin-Ashi close price falls 0.5% compared to the previous candlestick.
Specifically, the strategy first calculates the percentage change between the current close price and the previous close price, i.e. priceChange = close / close[1] - 1. If priceChange >= 0.005, a long signal is issued. If priceChange <= -0.005, a short signal is issued.
When issuing signals, the strategy also judges whether there is an existing position. If already in position (long or short), no signal will be repeated. If there is no position, it will issue open position signals based on the buy or sell conditions.
Finally, plotshape is used to mark the buy and sell signals on the chart.
Advantages
- Using Heikin-Ashi rate of change as trading signal, which captures price trend changes better than simple moving average etc.
- Issuing signals based on tiny 0.5% price changes, making it extremely sensitive and suitable for short-term trading
- Very simple and straightforward logic, easy to understand and implement
- Applicable to multiple timeframes, highly flexible
Risks and Solutions
- Heikin-Ashi itself focuses more on short-term price action, prone to market noise and false signals
- Adjust parameters like only reacting to 1% or 2% changes to lower false signal rates
- Too sensitive, may over-trade frequently incurring higher fees
- Adjust holding period, e.g. 2 hours minimum each trade, to avoid high frequency trading
- Too many graphical markers cluttering the chart
- Hide plotshapes and only check signals from strategy log
Optimization Directions
The main aspects to optimize this strategy:
- Adjust price change threshold based on market volatility and trading style to find optimum parameters
- Incorporate stop loss to limit max loss percentage per trade
- Add filter with other indicators to avoid unnecessary trades during consolidation
- Introduce position sizing for fixed quantity, exponential, grid trading etc.
- Optimize entry mechanisms, avoid whipsaws, trade with trend or counter trend
Conclusion
In summary, this is a very simple, low parameter, easy to understand short-term trading strategy. It catches price changes extremely fast, suitable for high frequency traders. But also need to control number of trades to reduce costs. With several optimization methods, it can achieve even better results.
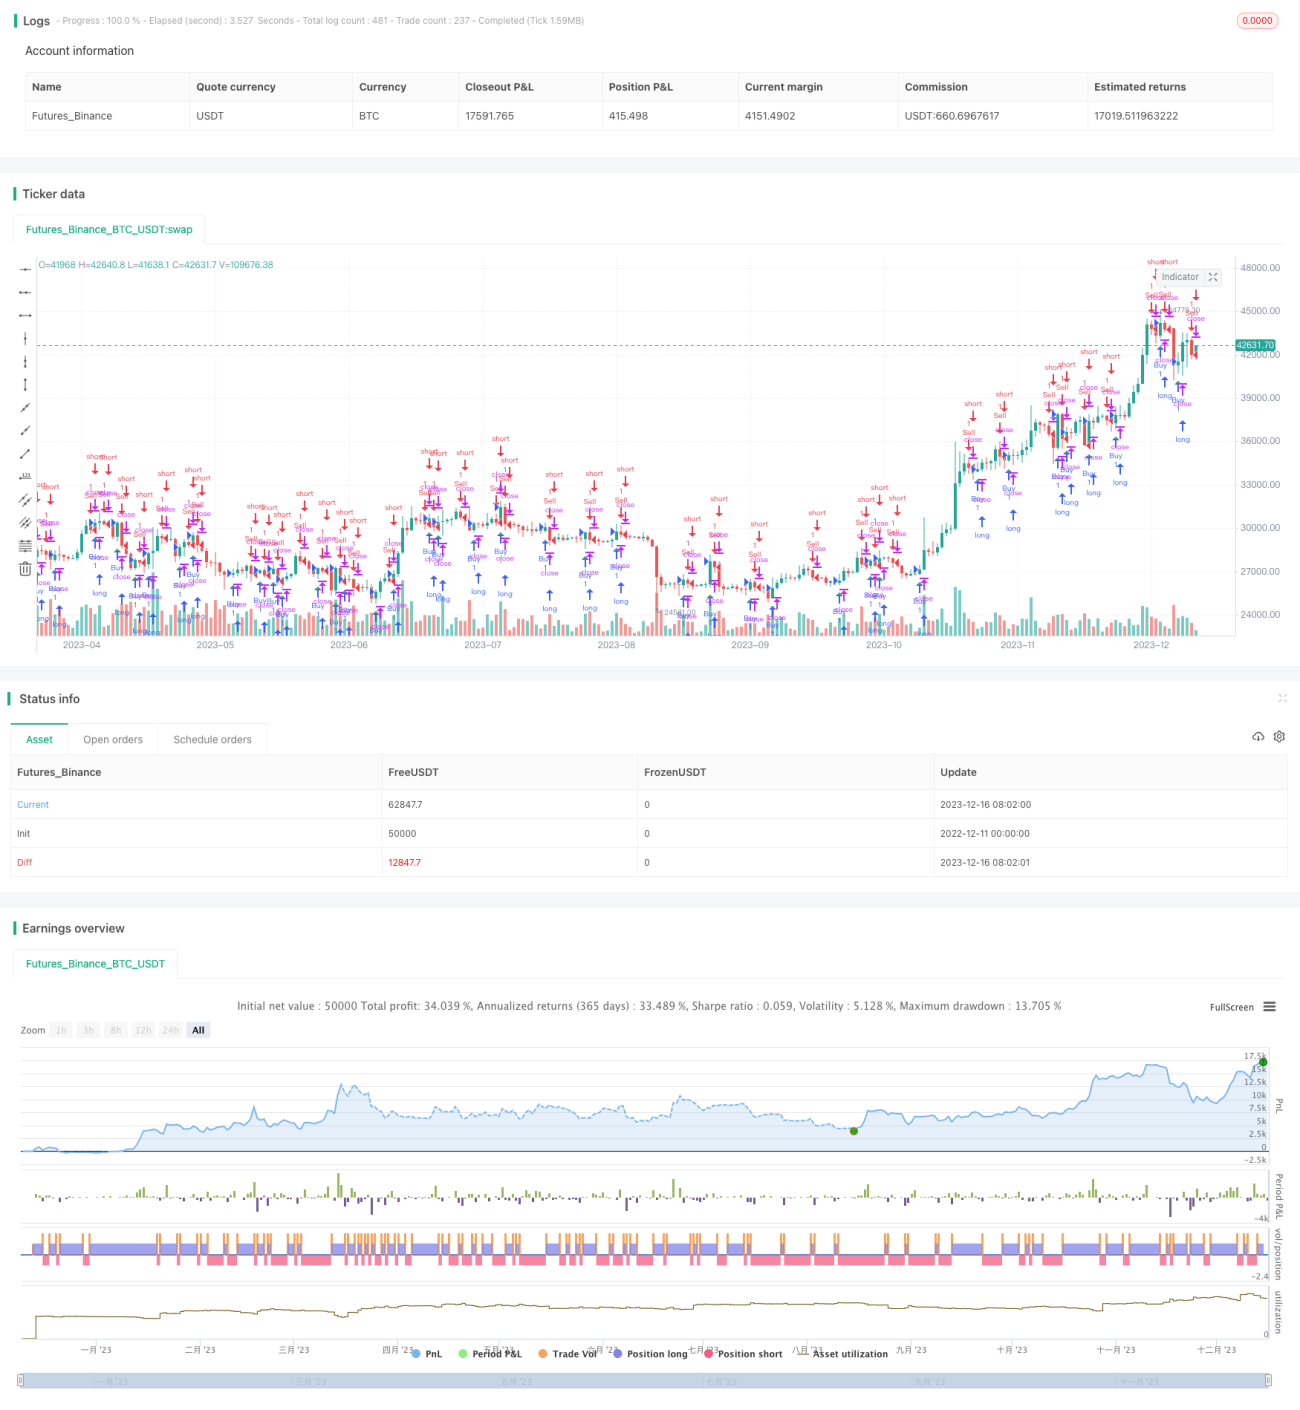
/*backtest
start: 2022-12-11 00:00:00
end: 2023-12-17 00:00:00
period: 1d
basePeriod: 1h
exchanges: [{"eid":"Futures_Binance","currency":"BTC_USDT"}]
*/

//@version=4
strategy("Heikin-Ashi - Change 0.5% short Time Period", shorttitle="Heikin-Ashi - Change 0.5% short Time Period", overlay=true)

// Calculate 0.5% price change- 1