概述
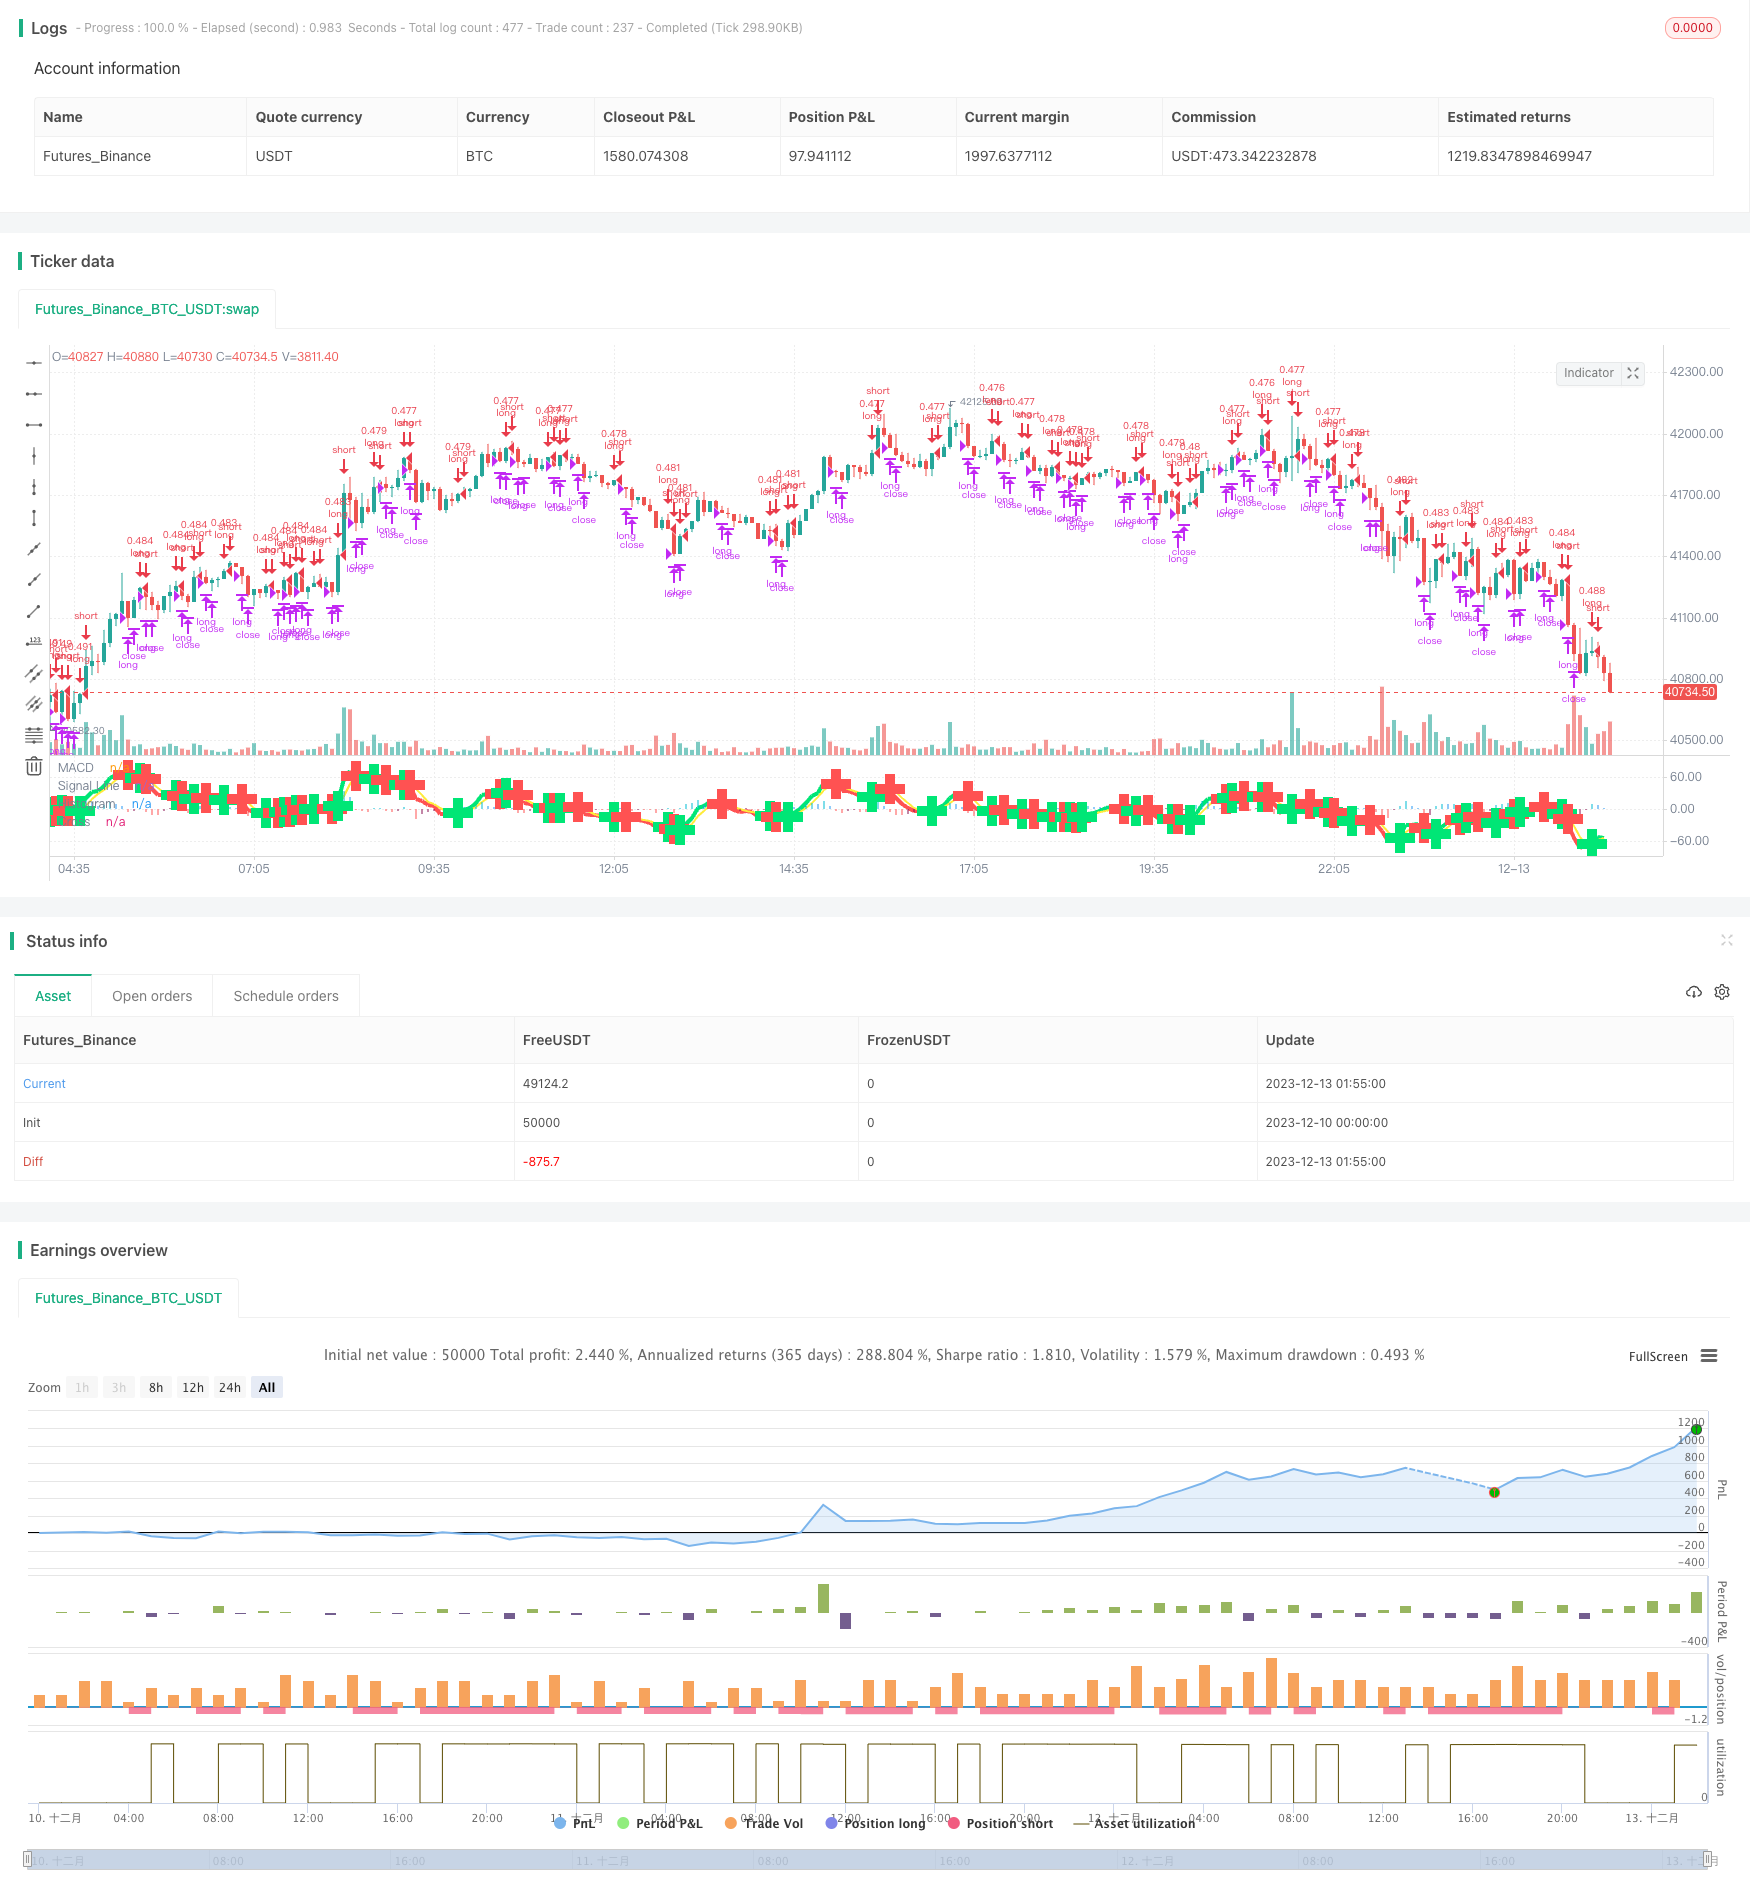
本策略名为MACD双均线追踪策略,采用MACD指标的双均线金叉死叉作为交易信号,结合昨日最低价作为止损点,追踪股价短线移动。
策略原理
- 计算快线EMA(close,5)、慢线EMA(close,8)和信号线SMA(MACD,3)
- 定义多头信号:快线上穿慢线时做多
- 定义空头信号:快线下穿慢线或当日收盘价低于昨日最低价时做空
- 持仓量为初始资金2000美元除以收盘价
- 多头止损使用空头信号平仓
优势分析
- 使用MACD指标判断市场超买超卖区域,配合双均线形成交易信号,避免假突破
- 追踪短期趋势,及时止损
- 持仓量动态调整,避免单笔损失过大
风险分析
- MACDIndicator存在滞后,可能错过短线机会
- 双均线交易信号可能产生假信号
- 止损点过于激进,存在过度频繁止损的可能
优化方向
- 优化MACD参数组合,提高指标敏感性
- 增加趋势判断,避免震荡市产生的假信号
- 结合Volatility Index评估市场波动率,调整止损点
总结
本策略采用经典的MACD双均线组合指标判断超买超卖区间,产生交易信号,同时引入动态持仓量和前日最低价的止损点设计,针对股价的短线波动特征进行捕捉,整体策略思路清晰易懂,值得进一步测试优化。
策略源码
/*backtest
start: 2023-12-10 00:00:00
end: 2023-12-13 02:00:00
period: 5m
basePeriod: 1m
exchanges: [{"eid":"Futures_Binance","currency":"BTC_USDT"}]
*/

//@version=2
// macd/cam v1 strategizing Chris Moody Macd indicator https://www.tradingview.com/script/OQx7vju0-MacD-Custom-Indicator-Multiple-Time-Frame-All-Available-Options/
// macd/cam v2 changing to macd 5,8,3
// macd/cam v2.1
//      Sell when lower than previous day low.
//      Initial capital of $2k. Buy/sell quantity of initial capital / close price
//      Quitar short action
//      Note: custom 1-week resolution seems to put AMD at 80% profitable

strategy(title="MACD/CAM 2.1", shorttitle="MACD/CAM 2.1") //
source = close
//get inputs from options
useCurrentRes = input(true, title="Use Current Chart Resolution?")
resCustom = input(title="Use Different Timeframe? Uncheck Box Above", defval="60")
smd = input(true, title="Show MacD & Signal Line? Also Turn Off Dots Below")
sd = input(true, title="Show Dots When MacD Crosses Signal Line?")
sh = input(true, title="Show Histogram?")
macd_colorChange = input(true,title="Change MacD Line Color-Signal Line Cross?")
hist_colorChange = input(true,title="MacD Histogram 4 Colors?")
venderLowerPrev = input(true,title="Vender cuando closing price < previous day low?")

res = useCurrentRes ? timeframe.period : resCustom

fastLength = input(5, minval=1), slowLength=input(8,minval=1)
signalLength=input(3,minval=1)

// find exponential moving average of price as x and fastLength var as y
fastMA = ema(source, fastLength)
slowMA = ema(source, slowLength)

macd = fastMA - slowMA
// simple moving average
signal = sma(macd, signalLength)
hist = macd - signal

outMacD = request.security(syminfo.tickerid, res, macd)
outSignal = request.security(syminfo.tickerid, res, signal)
outHist = request.security(syminfo.tickerid, res, hist)

histA_IsUp = outHist > outHist[1] and outHist > 0
histA_IsDown = outHist < outHist[1] and outHist > 0
histB_IsDown = outHist < outHist[1] and outHist <= 0
histB_IsUp = outHist > outHist[1] and outHist <= 0

//MacD Color Definitions
macd_IsAbove = outMacD >= outSignal
macd_IsBelow = outMacD < outSignal

plot_color = hist_colorChange ? histA_IsUp ? aqua : histA_IsDown ? blue : histB_IsDown ? red : histB_IsUp ? maroon :yellow :gray
macd_color = macd_colorChange ? macd_IsAbove ? lime : red : red
signal_color = macd_colorChange ? macd_IsAbove ? yellow : yellow : lime

circleYPosition = outSignal

plot(smd and outMacD ? outMacD : na, title="MACD", color=macd_color, linewidth=4)
plot(smd and outSignal ? outSignal : na, title="Signal Line", color=signal_color, style=line ,linewidth=2)
plot(sh and outHist ? outHist : na, title="Histogram", color=plot_color, style=histogram, linewidth=4)

circleCondition = sd and cross(outMacD, outSignal)

// Determine long and short conditions
longCondition  = circleCondition and macd_color == lime

redCircle = circleCondition and macd_color == red
redCirclePrevLow = redCircle or low<low[1]
shortCondition = redCircle
if (venderLowerPrev)
    shortCondition = redCirclePrevLow

strategy.initial_capital = 20000
// Set quantity to initial capital / closing price
cantidad = strategy.initial_capital/close

// Submit orders
strategy.entry(id="long", long=true, qty=cantidad, when=longCondition)
strategy.close(id="long", when=shortCondition)
plot(circleCondition ? circleYPosition : na, title="Cross", style=cross, linewidth=10, color=macd_color)
// hline(0, '0 Line', linestyle=solid, linewidth=2, color=white)