Pivot Reversal Strategy

Overview
This article will analyze in detail a reversal trading strategy based on pivot points. The strategy calculates potential support and resistance pivot levels over a period, and identifies trend reversals when price breaks through these pivot levels, allowing reversal trades.
Strategy Logic
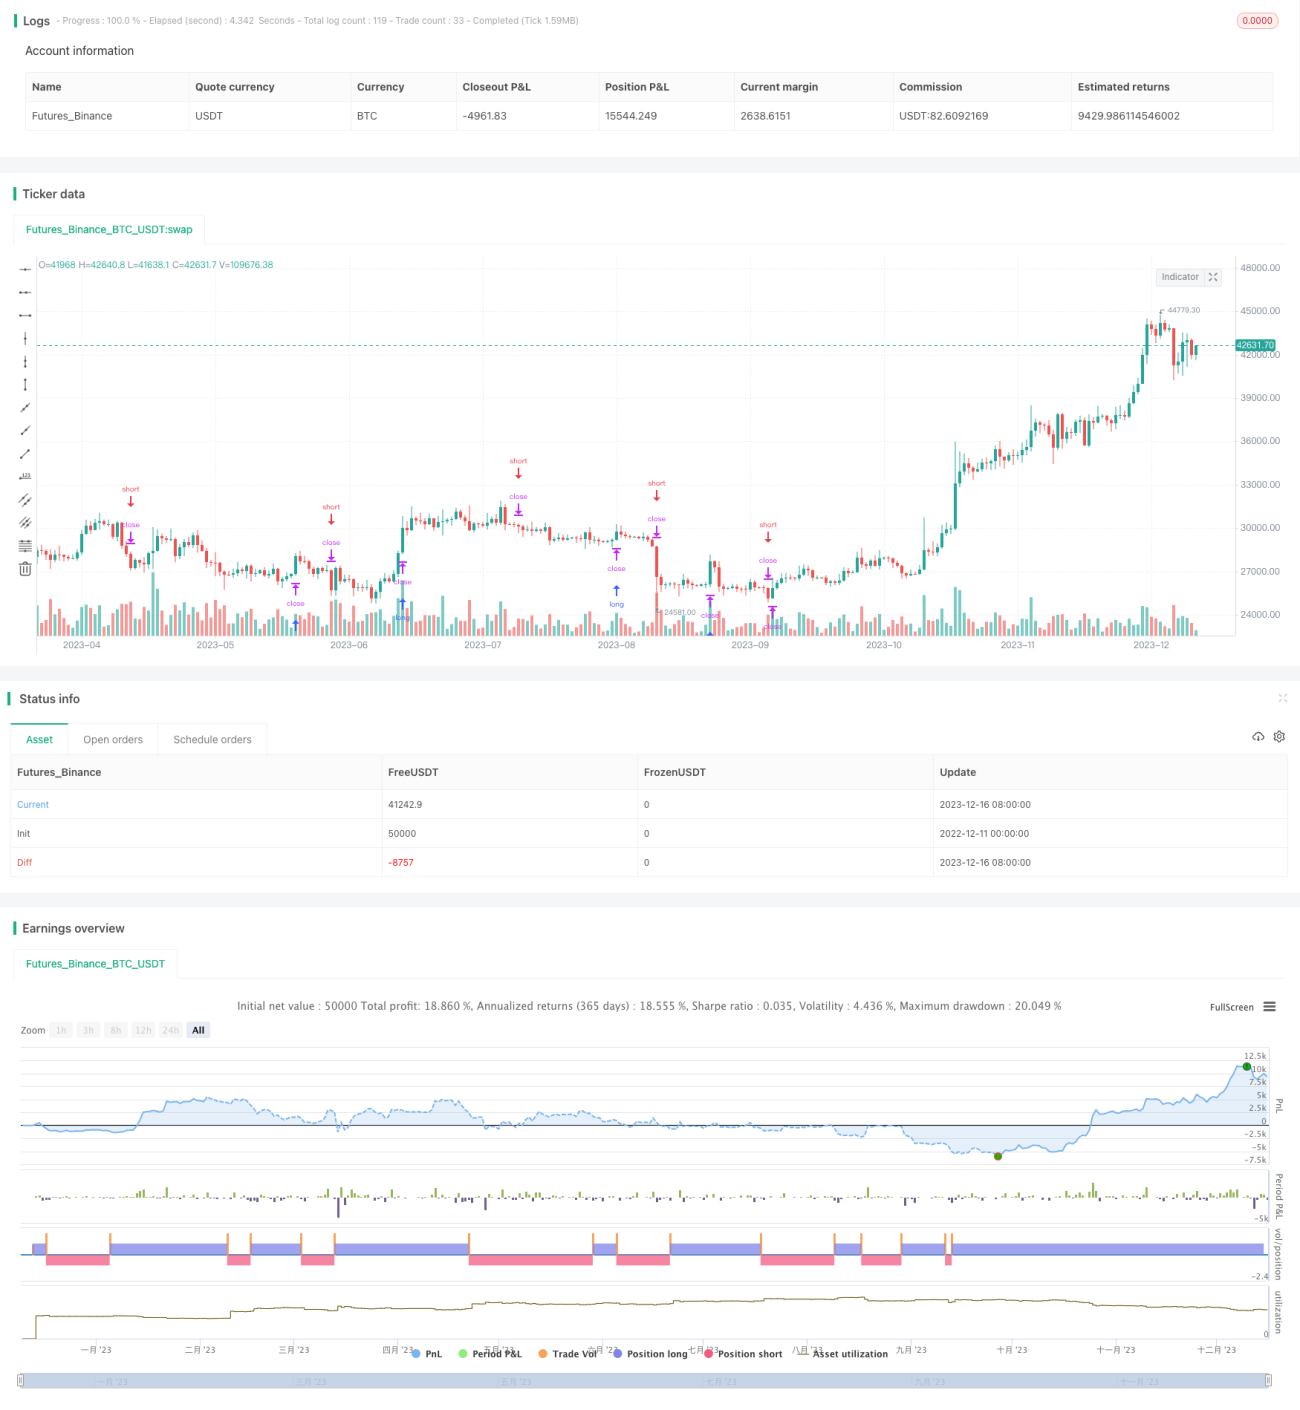
The strategy mainly relies on two indicators: Pivot High and Pivot Low. Pivot highs and lows are the highest and lowest prices within a period, and can be obtained using the pivothigh() and pivotlow() functions. When computing pivot points, the periods to the left and right need to be set; this strategy uses 4 periods to the left and 2 periods to the right.
When the highest price of the latest period is lower than the previous period's pivot high, it signals a reversal opportunity. If previous positions were short, long positions should now be considered to capitalize on the reversal. Similarly, when the latest period's lowest price is higher than the previous pivot low, existing long positions should consider reversing to short.
Specifically, the main logic is:
- Compute pivot high/low levels
- Identify breakthroughs
- Long when price breaks above pivot low
- Short when price breaks below pivot high
- Set stop loss levels
Advantage Analysis
The biggest advantage of this strategy is identifying potential trend reversal points, which is crucial for reversal traders. Compared to other indicators, pivot points can more clearly identify key support/resistance levels without frequent false signals.
Moreover, the strategy has conditions for both long and short entries, covering different market situations to avoid missing opportunities. The use of stop loss controls risk and ensures a good risk/reward ratio.
In summary, this is a very practical reversal strategy.
Risk Analysis
Despite efforts to reduce false signals, any breakout-based strategy inevitably faces issues like premature or lagging signals. This could result in planning a long entry but the market has already reversed, or planning a short but a bull run suddenly erupts. Such inability to perfectly predict reversals is an inherent limitation of technical analysis.
Additionally, pivot points cannot guarantee perfect support/resistance levels either. Bad luck could result in stop loss hitting just before the real support level. Such uncertainty around key zones cannot be fully avoided.
Enhancement Opportunities
-
Period optimization. The current left/right periods are set at 4 and 2. These can serve as initial values and be further optimized for each market.
-
Add filters with other indicators. For example, combine with volume to only consider breakouts as valid when accompanied by increasing volume. This helps avoid false breakouts.
-
Dynamic stop loss. Currently stops are set with a buffer of one minimum tick above/below pivot levels. The buffer zone can be dynamically adjusted based on market volatility.
-
Operate only in trend direction. Currently long/short conditions are in parallel. An optimization is to only long in uptrends and short in downtrends based on a trend filter.
Conclusion
In summary, this is a simple yet practical reversal strategy. Identifying pivot points over a period and monitoring price breakthroughs forms the core idea for detecting potential trend reversals. The parallel long/short conditions maximize opportunities while stop losses manage risk.
The strategy logic is straightforward and easy to implement. The parameters are also intuitive for beginners. Further optimizations can improve performance for adoption. Overall this is a recommended strategy.
- 1