Bayesian Condition RSI Trading Strategy

Overview
This article mainly analyzes a quantitative trading strategy called "Bayesian Condition RSI Trading Strategy". This strategy calculates the probability distribution of the RSI indicator and applies Bayesian rule to infer the probability of the RSI indicator continuing to rise or fall to judge future price trends and make profits.
Strategy Principle
The core logic of this strategy is:
- Calculate probability distribution A of whether the closing price has risen within a certain cycle
- Calculate probability distribution B of whether the RSI indicator continues to rise within the corresponding cycle
- Apply Bayesian rule to calculate the probability of A and B occurring simultaneously
- When this probability is higher than the threshold, judge that the trend will continue and take trading signals
Specifically, the strategy first defines the parameter p as the cycle parameter for calculating the RSI indicator, and r as the time range for predicting future price changes. Then within the p cycle, count the number of times the closing price rises to calculate the probability distribution A. At the same time, within the p cycle, count the number of times the RSI continues to rise within the r cycle after this cycle ends, and calculate the probability distribution B.
After that, apply the Bayesian formula to calculate the probability that the two conditions of "closing price rise" and "RSI continue to rise" are satisfied at the same time, as the final probability judgment indicator. When this probability is higher than a given threshold, judge that the uptrend will continue and take long positions; when the probability is lower than the threshold, judge that the trend is reversed and close positions.
In this way, the strategy comprehensively considers price information and technical indicators, applies probability statistics and Bayesian rules to judge future trends and generate trading signals.
Advantages of the Strategy
The main advantages of this strategy are:
-
Combining multiple information: The strategy considers not only price information, but also technical indicator information such as RSI to comprehensively judge future trends and improve judgment accuracy.
-
Probability prediction: Make probability predictions on the direction of price and RSI changes through statistical probability distribution, instead of simple numerical comparison, making the judgment more scientific.
-
Bayesian optimization: Use Bayesian rules to calculate relevant probabilities and optimize original statistical probabilities to make judgments more accurate.
-
Flexible parameters: Provide multiple parameters for adjustment and optimization to fit different markets and assets and improve adaptability of the strategy.
-
Simple and effective: The strategy idea is clear and simple statistical and probability operations are used to generate trading signal judgments, which is easy to understand and optimize, and the effect is significant.
Risks of the Strategy
The main risks of this strategy also include:
-
Parameter dependence: The performance relies heavily on parameter settings. Different markets need to adjust many parameters to achieve optimal results, increasing complexity of strategy operation.
-
Probability error: Due to limited statistical time and samples, the calculated probability may not match the real trend, leading to judgment deviation.
-
Special events: Major emergencies may affect the correlation between market prices and RSI indicators, causing strategy failure.
-
Technical indicator failure: In some market situations, technical indicators like RSI may produce invalid signals, leading to strategy judgment failure.
Solutions include: optimizing parameter setting process, adjusting statistical time and sample size, combining more auxiliary information, manual intervention in abnormal situations, etc.
Optimization Directions
The main optimization directions of this strategy include:
-
Multiple timeframes: Running strategies across multiple timeframes (daily, weekly etc) for integrated judgment to improve stability.
-
More indicators: Adding more technical indicator signals like candlestick patterns, moving averages etc to enrich basis for judgment.
-
Model optimization: Using machine learning etc to optimize the Bayesian model for more accurate calculations.
-
Dynamic parameters: Adding dynamic optimization modules for parameters to adjust in real-time with market changes.
-
Risk control mechanism: Setting risk metrics like maximum drawdown and trade frequencies to prevent huge losses in extreme markets.
-
Ensemble improvements: Ensemble with other strategy types or models to form voting mechanisms and improve stability.
Conclusion
This strategy first statistically calculates probability distributions of price and RSI, then uses Bayesian rules to compute combined probabilities, generating trading signals when probabilities exceed set thresholds, thus profiting. This strategy combines multi-source information, leverages probability prediction and Bayesian optimization for decent judgment performance. Main optimization directions include timeframe expansion, more indicators, dynamic parameters etc. In conclusion, this strategy has a unique idea and remarkable effect that is worth exploring and applying.
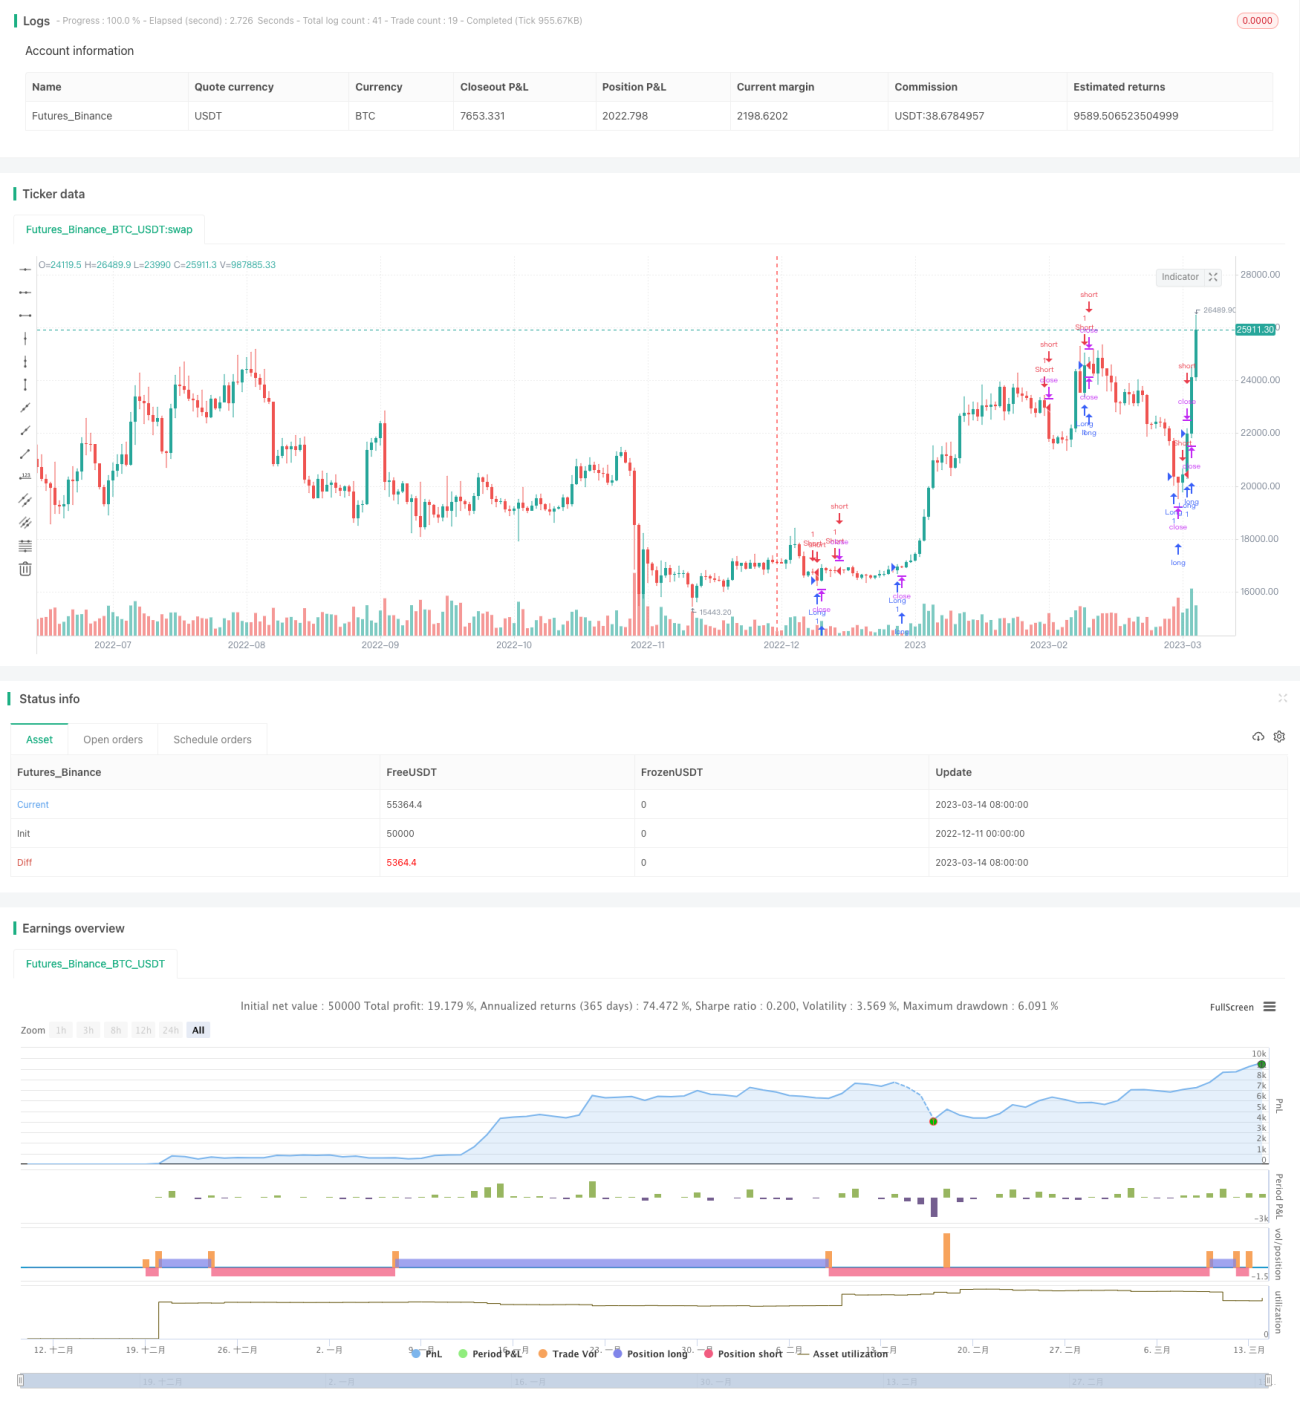
/*backtest
start: 2022-12-11 00:00:00
end: 2023-03-15 00:00:00
period: 1d
basePeriod: 1h
exchanges: [{"eid":"Futures_Binance","currency":"BTC_USDT"}]
*/

//@version=2
// Stealthy7 trading scripts are radikal. You have entered the mystical realm of demonic profit.
// If you like this script, check out my bots at cryptotrader.org/?r=51
// Let me know if you find any improvements to this script. It is beta. - 1