MACD Robot Trading Strategy

Overview
This strategy is called MACD Robot Trading Strategy. It determines the timing of buying and selling in the market by calculating the relationship between the MACD indicator's fast line and slow line, and adopts trailing stop loss to control risks.
Strategy Principle
This strategy is mainly developed based on the MACD indicator. The MACD indicator consists of a fast line and a slow line. The fast line is a short-term moving average and the slow line is a long-term moving average. The relationship between the two reflects the state of buying and selling in the market. When the fast line crosses above the slow line, it is a buy signal, and when it crosses below, it is a sell signal.
In this strategy, the fast line and slow line are calculated using the EMA algorithm respectively, and the periods can be customized. In order to improve the signal quality, a signal line is added, which uses the EMA algorithm to smooth the MACD value again.
When determining the timing of buying, check not only the golden cross of fast and slow lines, but also whether the absolute value of MACD is greater than the customized buy line. If yes, a buy signal is issued and trailing stop loss is used to control risks.
When determining the timing of selling, the death cross of fast and slow lines and the signal line being positive are required to be met at the same time, then a sell signal is issued to close the position.
Advantage Analysis
The strategy has the following advantages:
- Using MACD indicator to determine trading signals with high reliability
- Increasing signal line improves signal quality
- Trailing stop loss effectively controls risks
- Customizable buy line adjusts strategy sensitivity
- All conditions are based on indicator calculation, not affected by external factors
Risk Analysis
The strategy also has some risks:
- MACD indicator has lagging, may miss short-term trading opportunities
- Improper setting of stop loss point may cause unnecessary losses
- Parameter Tuning requires a lot of time for testing and adjustment
- Impact of transaction costs and slippage
These risks can be reduced by appropriately adjusting parameters, combining other indicators, etc.
Optimization Directions
The strategy can be optimized in the following directions:
- Combine with other indicators to filter signals, such as KDJ, RSI, etc.
- Add machine learning algorithms to determine entry and exit points
- Use dynamic stop loss instead of static stop loss
- Test and optimize MACD parameters and buy line
- Consider the impact of transaction costs to adjust strategy
Conclusion
Overall, this is a trend-following strategy with high reliability. By judging the trend through MACD indicator and controlling risks with trailing stop loss, stable investment returns can be obtained. NEXT STEP is to further optimize parameters, combine other indicators, and incorporate machine learning to improve strategy profitability.
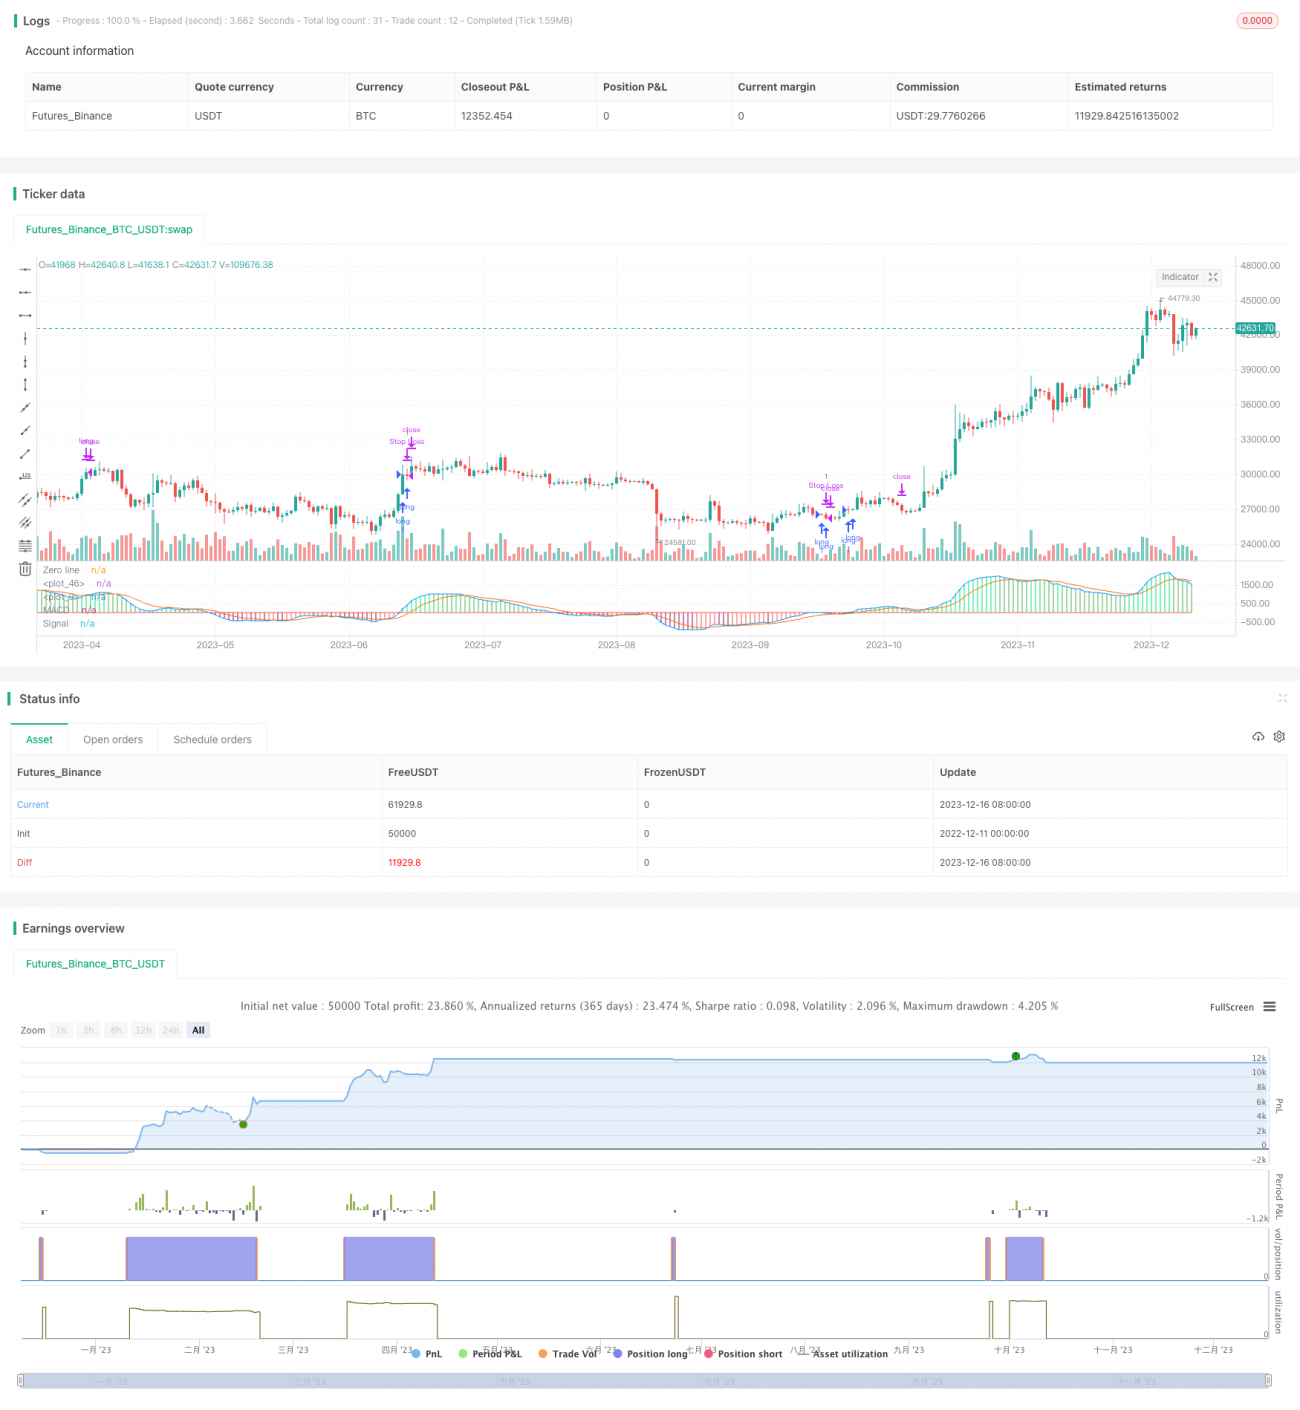
/*backtest
start: 2022-12-11 00:00:00
end: 2023-12-17 00:00:00
period: 1d
basePeriod: 1h
exchanges: [{"eid":"Futures_Binance","currency":"BTC_USDT"}]
*/

//@version=3
strategy(shorttitle = "GBPUSD MACD", title = "GBPUSD MACD")
fastMA = input(title="Fast moving average",  defval = 12, minval = 7)
slowMA = input(title="Slow moving average", defval = 26, minval = 7)- 1