SMA Offset Fluctuation Trading Strategy

Strategy Overview
This strategy uses simple moving averages (SMA) and some math calculations to determine buy/sell points. We keep a 100-day SMA line as our basis. If the closing price is below this line, we determine the opening position based on the percentage the price is below the line (low offset), which is configurable. Similarly, we set a high offset percentage above the 100-day SMA before closing long positions. If we try to close too early while price is still rising, the trailing stop loss will be triggered.
Strategy Logic
The strategy uses three SMA lines: fast line (default 14 days), slow line (default 100 days), and reference line (default 30 days).
It goes long when closing price is below reference line, percentage below slow line (low offset) is greater than configured value, fast line is rising and slow line is falling. When this condition satisfies, fast and slow line are very likely to cross soon, so it's a good entry point.
It closes long when closing price is above reference line, percentage above slow line (high offset) is greater than configured value, closing price rose for 3 consecutive candles, we have open profits, and fast line is above slow line. If price keeps rising after closing long, trailing stop loss will be triggered.
The order size is based on a percentage of total equity, this controls our position size.
Advantage Analysis
- Utilize the advantage of SMA being able to smooth price fluctuations and filter out market noise.
- SMA crossovers have some ability to predict trend changes.
- Setting offsets avoids false breakouts of SMA lines.
- Combining trend and crossover indicators improves accuracy of trading signals.
- Trailing stop loss locks in profits and prevents drawdowns.
Risk Analysis
- SMA itself has lag and may miss price turning points.
- Improper offset setting can make strategy too aggressive or too conservative.
- Improper stop loss parameter may stop out too early or stop loss percentage too large.
- Unable to cope with violent price swings.
Corresponding improvements:
- Add other leading indicators to filter entries.
- Backtest and optimize offsets.
- Backtest and find optimal stop loss parameters.
- Reduce position size during high volatility periods.
Optimization Directions
- Test SMAs of different periods to find optimal parameters.
- Add other indicators to determine market structure and trend.
- Optimize trailing stop loss parameters to lock in more profits.
- Adjust position sizing based on market volatility.
- Apply strategy to multiple products simultaneously for diversification.
Conclusion
The SMA Offset Fluctuation Trading Strategy identifies optimal entry points by setting offsets based on different SMA lines. The exit mechanism sets a trailing stop loss to lock in gains. This strategy is simple to understand and implement. By optimizing parameters like SMA periods, offsets, stop loss levels, better results can be achieved. It suits medium-long term investors seeking steady profits.
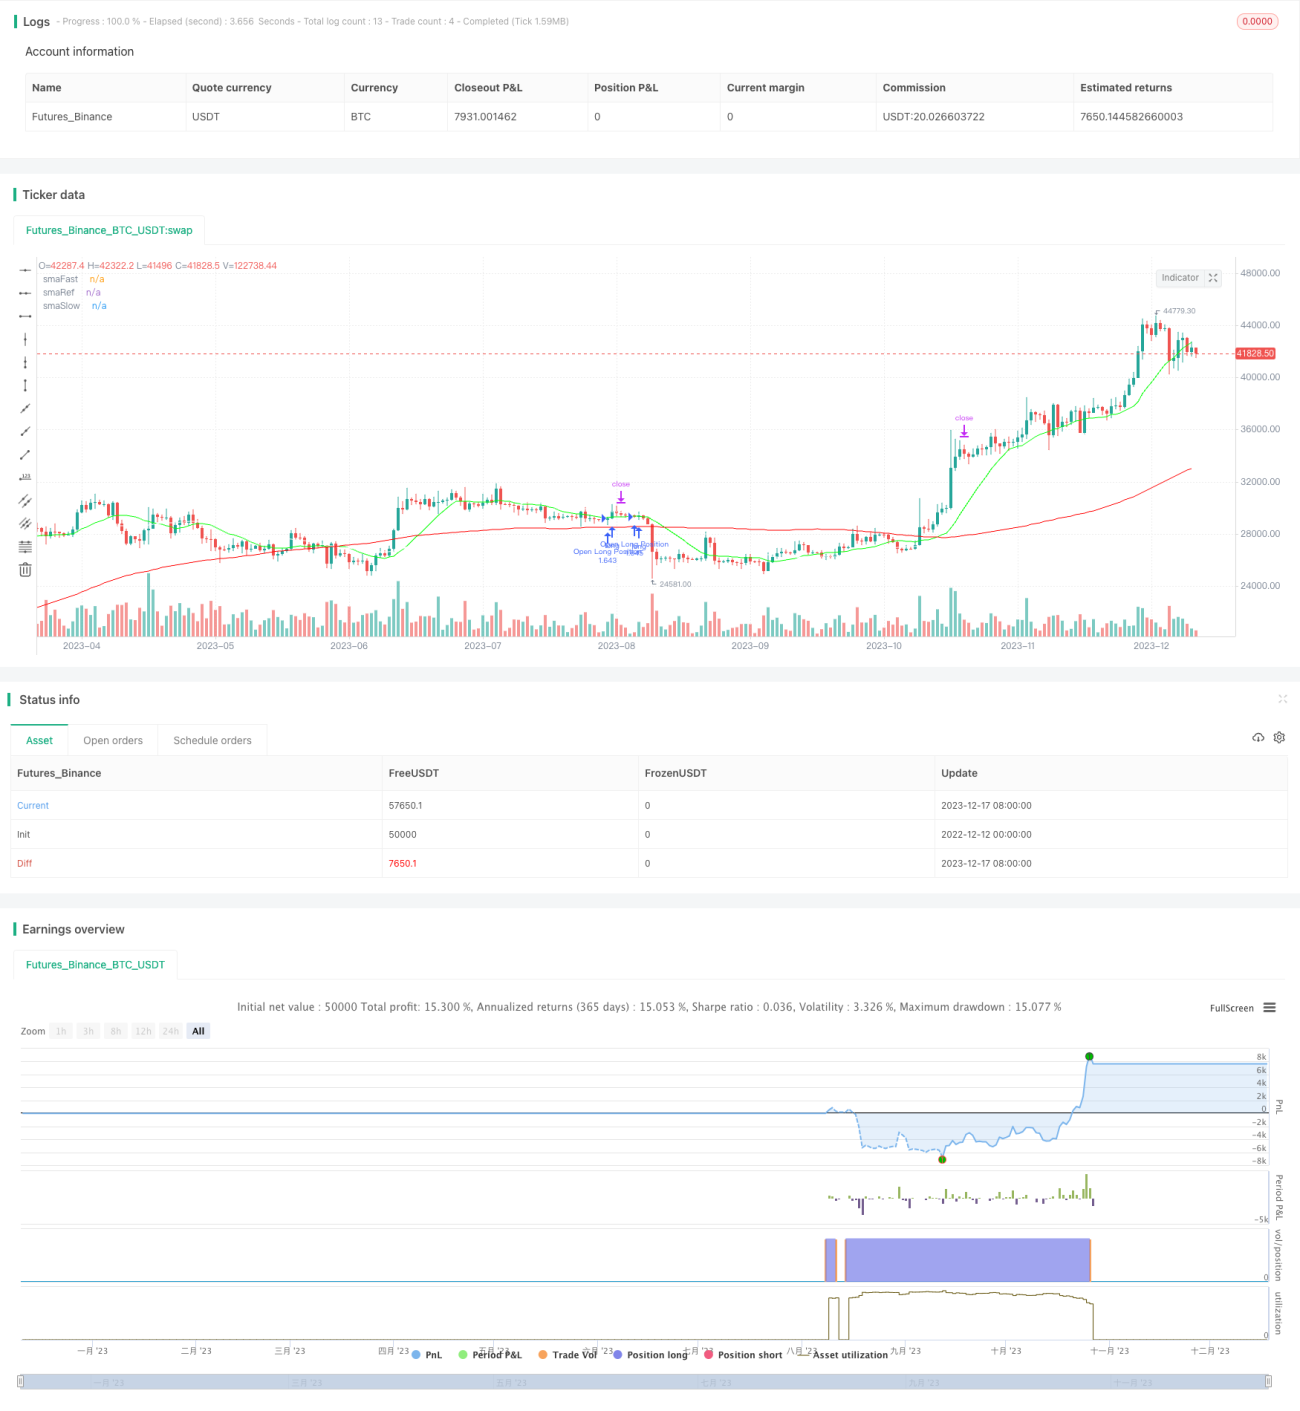
/*backtest
start: 2022-12-12 00:00:00
end: 2023-12-18 00:00:00
period: 1d
basePeriod: 1h
exchanges: [{"eid":"Futures_Binance","currency":"BTC_USDT"}]
*/

// @version=4
// Author: Sonny Parlin (highschool dropout)
strategy(shorttitle="SMA+Strategy", title="SMA Offset Strategy",
overlay=true, currency=currency.USD,- 1