Multi-indicator Combination Adaptive Trend Strategy

Overview
This strategy accurately judges the trend by combining the double Hull moving average indicator, volume weighted moving average indicator, MACD indicator and true strength index indicator. It can automatically adapt to changes in market conditions and has strong adaptability.
Strategy Principle
The core indicator of this strategy is the double Hull moving average, which is controlled by two parameters keh and teh. These two parameters determine the cycle of fast line and slow line respectively. The golden cross and dead cross formed by fast line and slow line judge the current trend.
The auxiliary judgment indicator is the volume weighted moving average meh1. When the price is higher than meh1, it is a bullish trend; when the price is lower than meh1, it is a bearish trend.
Another auxiliary judgment indicator is MACD. It is obtained by subtracting the fast moving average from the slow moving average to get MACD, and then using the moving average of MACD to get the signal line. When MACD is higher than the signal line, it is a bullish trend.
The last auxiliary judgment indicator is TSI, which is calculated by double smoothing the rate of change of price. Its absolute value magnitude represents the momentum of price change. In the buy and sell conditions, the signal line of TSI is judged to control the timing of Entries and Exits.
By combining the signals of these indicators, the trend can be accurately judged, and the parameters can be automatically adjusted to synchronize with the market.
Advantages
-
Using double Hull moving average as the main judgment indicator, combined with multiple other indicators, can improve judgment accuracy and reduce false signals.
-
Applying the TSI indicator to determine the timing of market entry and exit can control risks.
-
Multiple adjustable parameters for strong adaptability that can automatically adapt to market changes.
-
The idea of indicator combination and parameter self-adaptation makes the strategy stable with strong continuous profitability.
Risk Analysis
-
Although the TSI indicator is used to determine the timing, the indicators used in the algorithm are still trend types. If a shock and pullback market is encountered, it will increase fluctuations in profit and loss.
-
Improper parameter settings may cause strategy failure. Parameters need to be set reasonably based on experience.
-
The combination of multiple indicators increases the amount of calculation, which increases the possibility of errors in large data stocks and time periods. The data range needs to be controlled.
-
Need to monitor the calculation effect of indicators to prevent interference from abnormal data.
Optimization Direction
-
Other auxiliary indicators such as BOLL can be tested to make the signal more accurate and reliable.
-
Optimize entry and exit logic, set stop loss and take profit conditions to control single profit and loss.
-
Train and optimize parameters for different varieties to make them better suited for different varieties.
-
Increase the parameter self-adaptation module to automatically adjust the strategy parameters based on recent transaction effects.
Summary
This strategy integrates the advantages of multiple indicators and uses indicator combinations to judge trend direction. While controlling risks, it improves the accuracy of judgments. Through parameter optimization and logic optimization, the strategy can be better adapted to market changes, while reducing consecutive losses and gaining greater profits. This strategy is stable and can be used for stocks, cryptocurrencies and other varieties for long term.
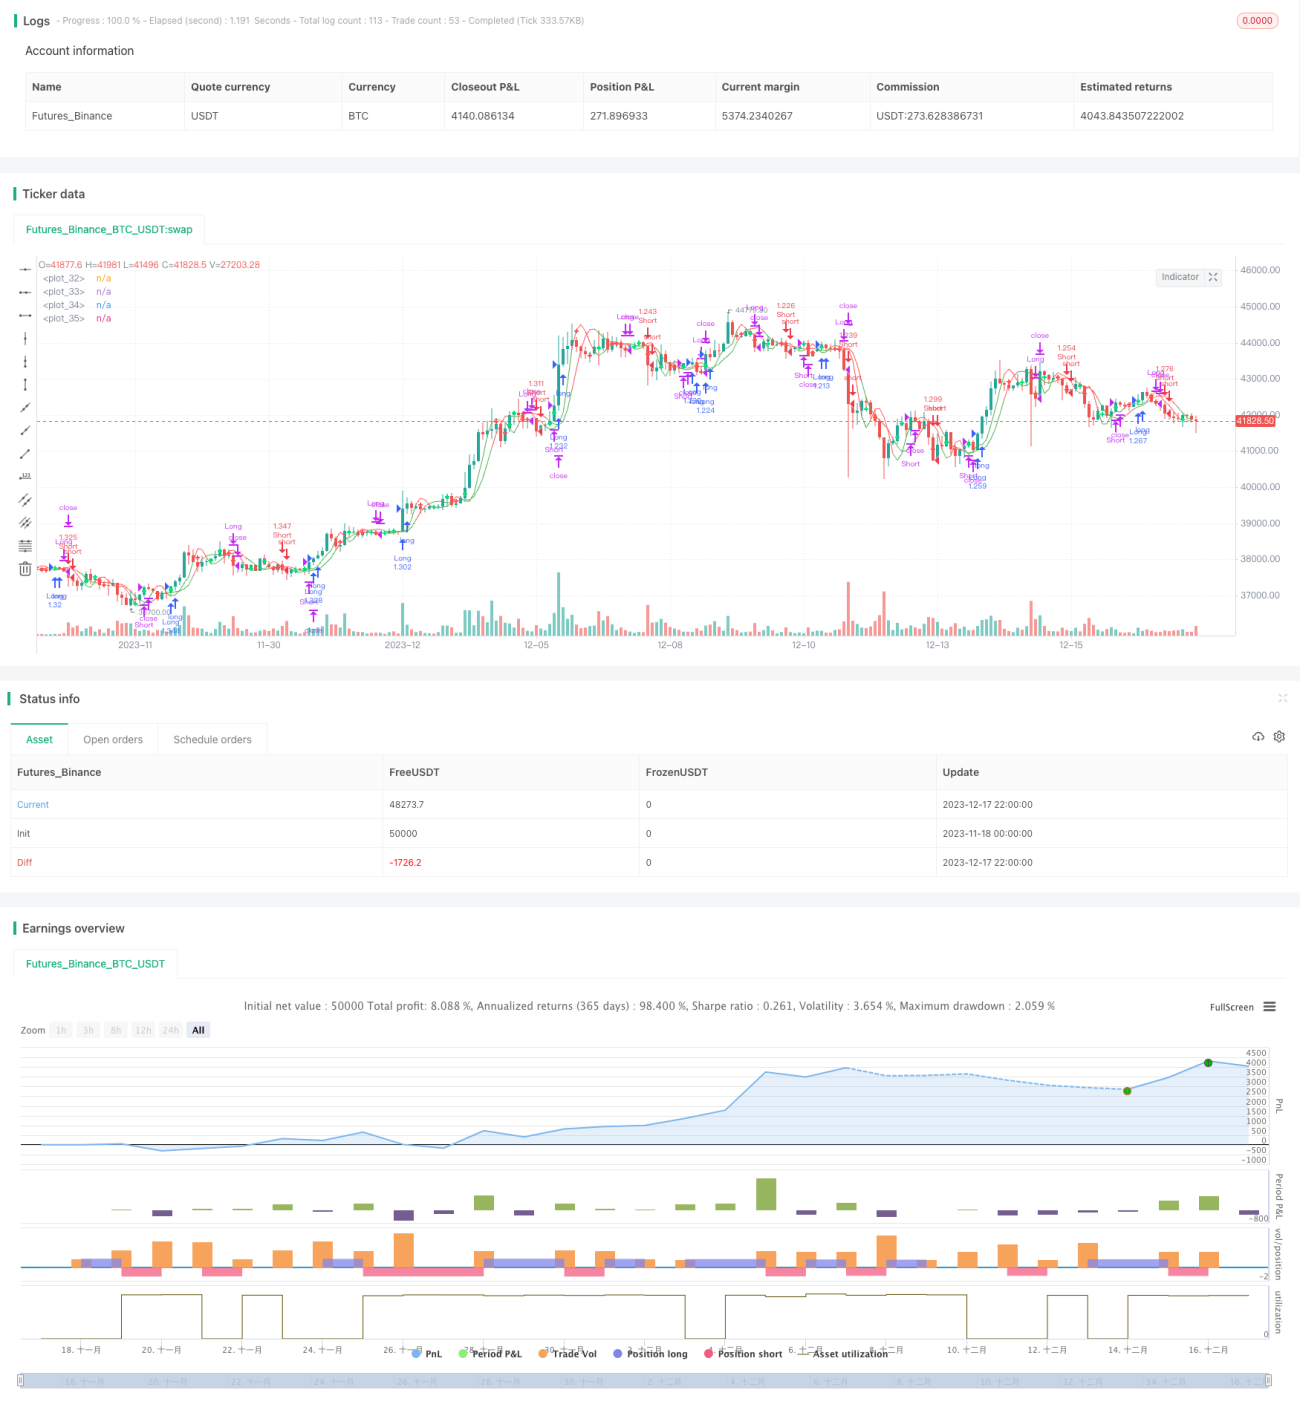
/*backtest
start: 2023-11-18 00:00:00
end: 2023-12-18 00:00:00
period: 2h
basePeriod: 15m
exchanges: [{"eid":"Futures_Binance","currency":"BTC_USDT"}]
*/

//@version=2
//                                                    Quad-HullMA-cross & VWMA & MacD & TSI combination  <<<<< by SeaSide420 >>>>>>
strategy("MultiCross420", overlay=true, calc_on_order_fills= true, calc_on_every_tick=true, default_qty_type=strategy.percent_of_equity, default_qty_value=100, pyramiding=0)
keh=input(title="Double HullMA 1",defval=7, minval=1)- 1