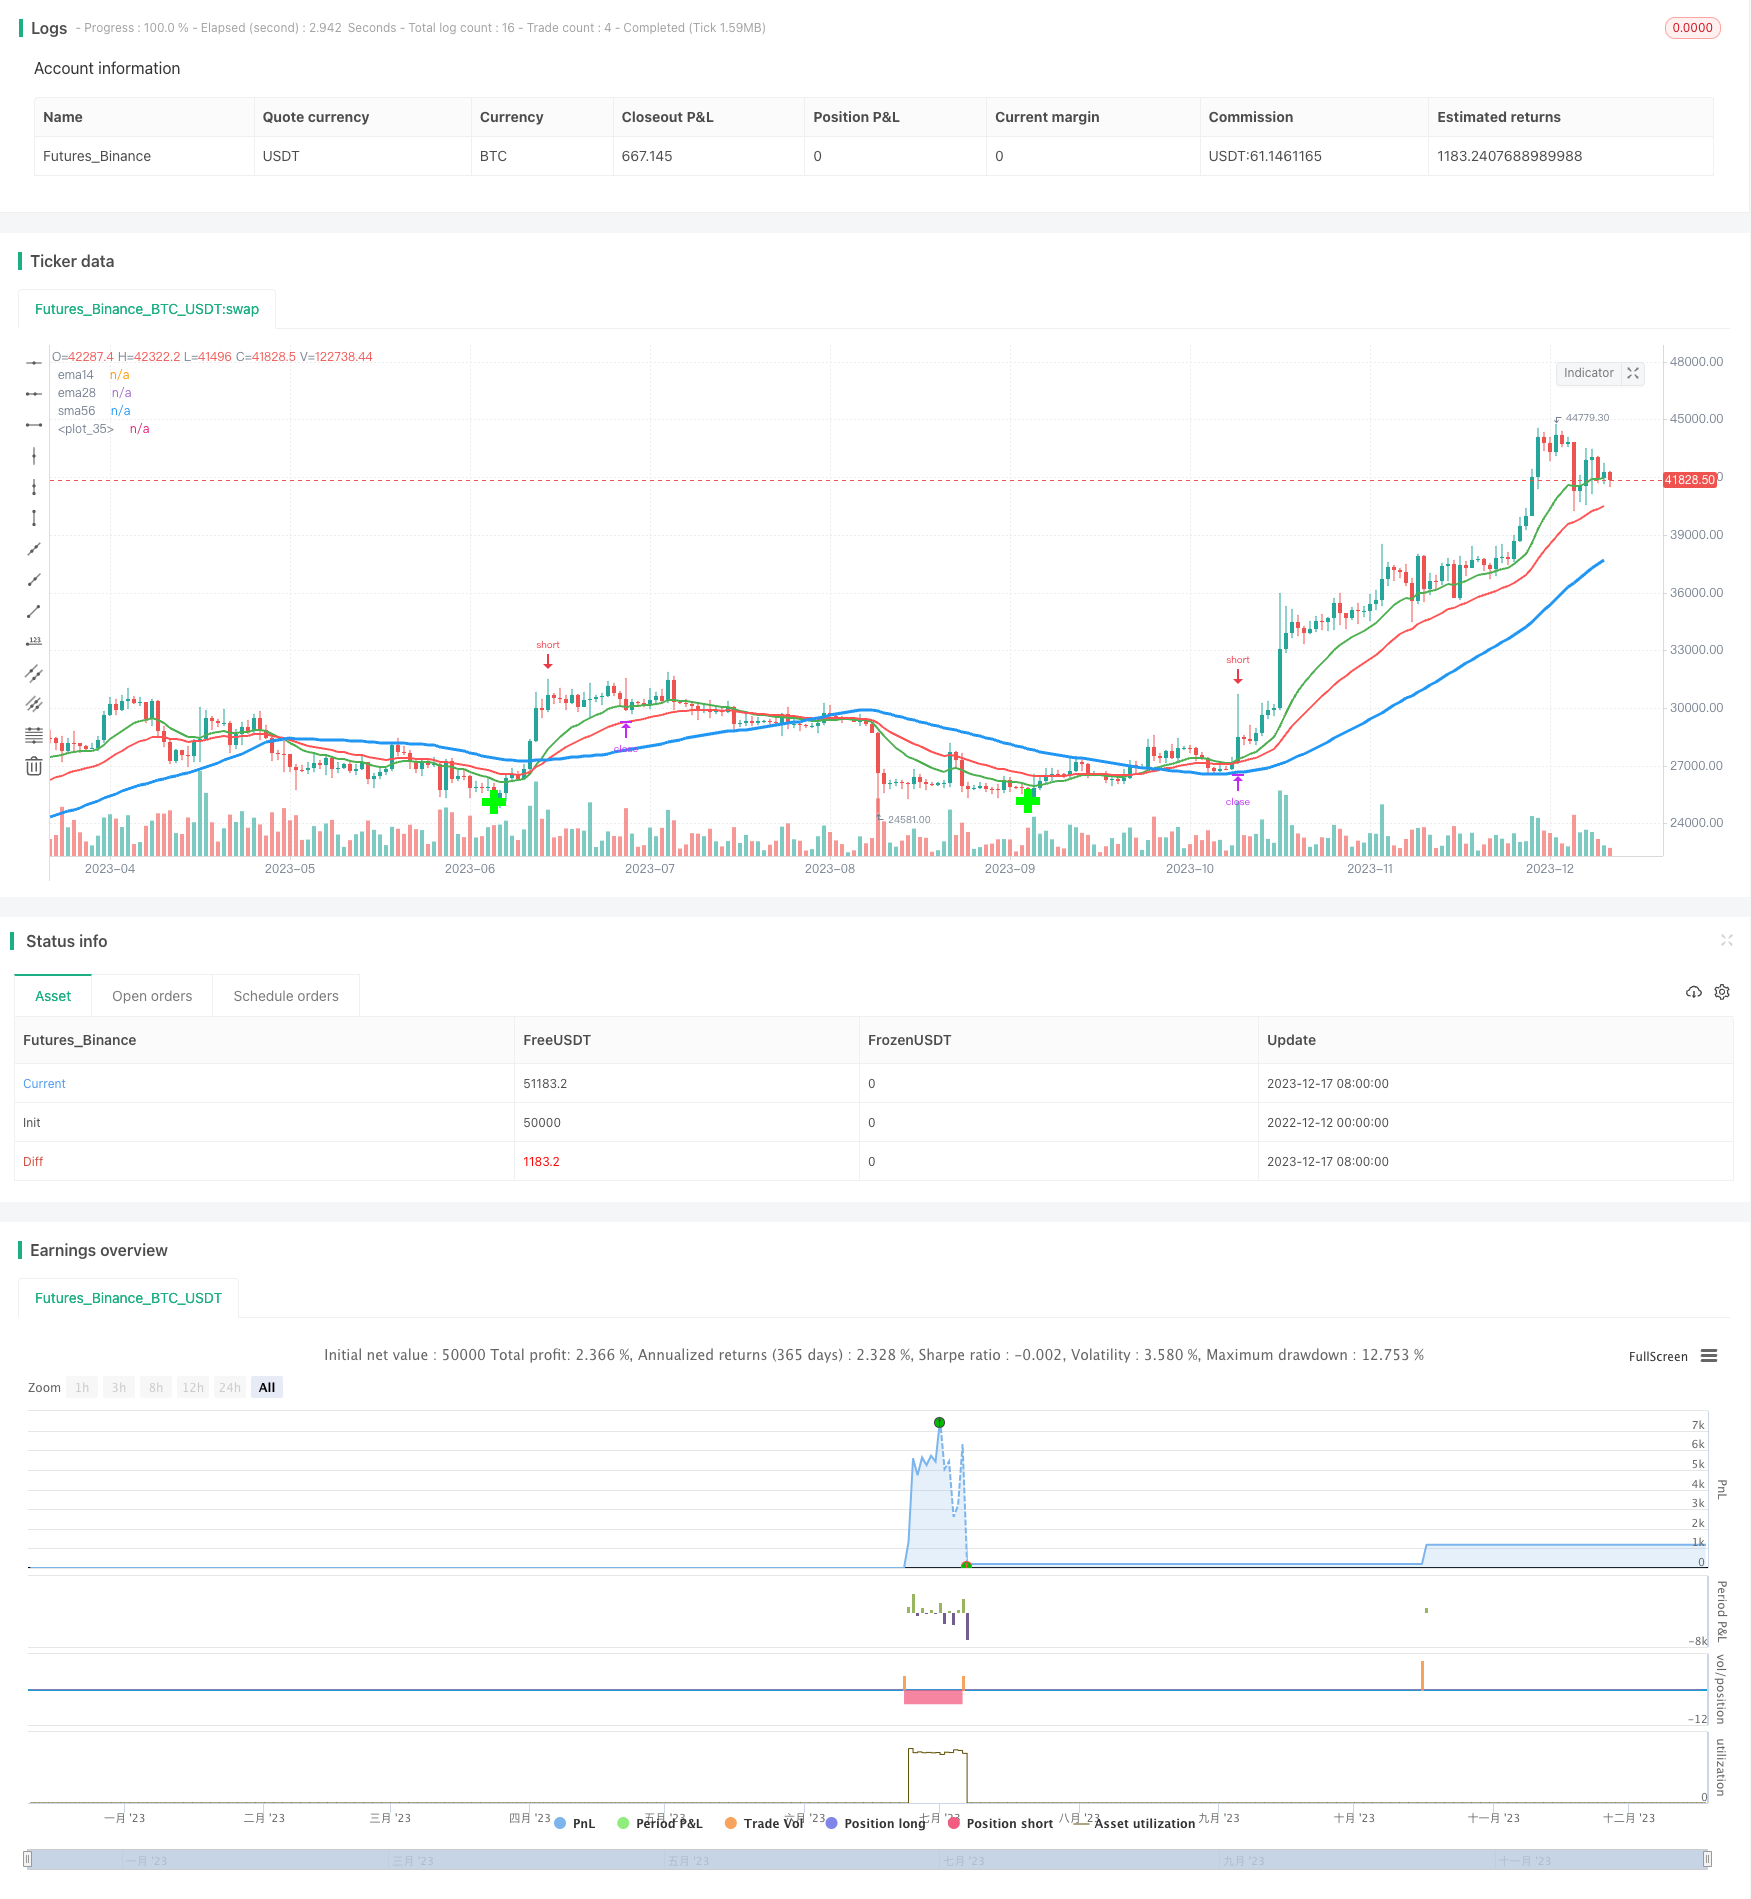
概述
移动平均线回拉策略是一种跟踪股价移动平均线的交叉情况,在发生金叉时判断是否有回拉机会,如果有,则进行逆向操作的量化交易策略。该策略借助Fibonacci回拉线,设定入市点和止损止盈点,实现对短期价格回拉的捕捉。
策略原理
该策略主要基于两个移动平均线:14日EMA和56日SMA。当14日EMA从下方上穿56日SMA时产生买入信号。此后,代码会回溯20日找到一个低点作为支撑,再结合穿越点的close价格绘制Fibonacci回拉线,以1.272倍回拉线作为 entrance,0.618倍回拉线作为exit。这样,strategy就会在发生金叉后设定一个entry point来做空,如果价格真的出现回拉达到0.618回拉线,则止盈退出。
整个策略主要分为以下几个步骤:
1. 计算14日EMA、56日SMA;
2. 判断是否发生EMA上穿SMA的金叉信号;
3. 回溯找到一个支撑的低点;
4. 利用低点与金叉点位置绘制Fibonacci 回拉线;
5. 在1.272回拉线设定做空入场点;
6. 在0.618回拉线设置止盈点。
以上就是策略的主要流程和工作原理。当价格出现短期的反转回拉时,这套策略可以捕捉这样的机会获利。
策略优势
这套移动平均线回拉策略主要具有以下几点优势:
- 策略思路清晰简单,容易理解和实现;
- 借助Fibonacci理论设定入场和止损点,风险控制比较好;
- 可以捕捉短期价格反转的机会,获得较好的单笔利润;
- 只需要一个移动平均线金叉信号就可以启动,条件不苛刻。
总的来说,这套策略非常适合用来做短线反转交易,在行情出现一定回调时可以捕捉这样的机会套利。策略实现也比较简单直接。
策略风险
尽管这套移动平均线回拉策略有它自己的优势,但也存在一定的风险需要注意:
- 长期持有可能造成较大损失。因为我们是逆势做空的,如果行情继续上涨,将面临巨大的损失。
- 回拉幅度过小无法获利。价格回拉幅度太小,无法触及止盈线,无法套现获利。
- 可能出现过高设置风险。回拉线设置过高,无法被触及形成套利机会。需计算合理的回拉区间。
对于上述风险,我们可以设置较短的止损时间,严格控制单笔损失;同时优化回拉线的区间范围,设定合理的目标利润,从而规避部分风险。
优化方向
这套移动平均线回拉策略还有很多优化的空间,主要可以从以下几个方面入手:
- 测试不同的参数设定,如移动平均线的周期长度、回溯天数、回拉线倍数等,找到最优参数;
2.增加止损机制,可以采用多重止损或移动止损,更好控制风险;
结合其他指标 FILTER,避免在不适宜的市场环境中交易;
优化资金管理,设定合理的头寸规模和风险敞口。
通过测试和优化参数,这套策略可以进一步改进,从而获得更稳定的交易表现。
总结
移动平均线回拉策略是一个非常实用的短线交易策略。它能捕捉价格在短期内出现的反转机会,通过事先设置的入场点和止损点进行交易。策略思路清晰简单,容易理解和实现。同时也存在一定的交易风险,需要通过参数优化、风险控制等手段进一步完善。总的来说,这是一套值得深入研究和应用的量化策略。
/*backtest
start: 2022-12-12 00:00:00
end: 2023-12-18 00:00:00
period: 1d
basePeriod: 1h
exchanges: [{"eid":"Futures_Binance","currency":"BTC_USDT"}]
*/

//@version=2
strategy("MAC Pullback", overlay=true)

// Setting up timeperiod for testing
startPeriodYear = input(2014, "Backtest Start Year")
startPeriodMonth = input(1, "Backtest Start Month")
startPeriodDay = input(2, "Backtest Start Day")
testPeriodStart = timestamp(startPeriodYear, startPeriodMonth, startPeriodDay, 0, 0)

stopPeriodYear = input(2035, "Backtest Stop Year")
stopPeriodMonth = input(12, "Backtest Stop Month")
stopPeriodDay = input(30, "Backtest Stop Day")
testPeriodStop = timestamp(stopPeriodYear, stopPeriodMonth, stopPeriodDay, 0, 0)

// Moving Averages
ema14 = ema(close, 14)
ema28 = ema(close, 28)
sma56 = sma(close, 56)

// Plot
plot(ema14, title="ema14", linewidth=2, color=green)
plot(ema28, title="ema28", linewidth=2, color=red)
plot(sma56, title="sma56", linewidth=3, color=blue)


// Strategy
goLong = cross(ema14, sma56) and ema14 > ema28
goShort = cross(ema14, sma56) and ema14 < ema28


// Locate Swing Lows
leftBars = input(20)
rightBars=input(20)
swinglow = pivotlow(close, leftBars, rightBars)
plot(swinglow, style=cross, linewidth=8, color=#00FF00, offset=-rightBars)

if goLong == true and time >= testPeriodStart and time <= testPeriodStop
    // We try to make sure that we're catching the first Pullback after the crossover
    if ema14[12] < sma56[12]
        pivotpoint = lowest(40)[0] //lowest value of the month as our swing low

        // We calculate a Fib 1.272 extension (from the previous swing low to
        // the crossover long entry's open) and use this as our entry target to short the Pullback
        extensiontarget = ((close[1] - pivotpoint) * 1.27) + pivotpoint
        shorttarget = ((close[1] - pivotpoint) * 0.618) + pivotpoint

        strategy.order("Pullback", strategy.short, 5.0, limit=extensiontarget)
        // I would like to use a trailing stop but for know we just hope to get
        // filled if the pullback reaches all the way down to the 0.618.
        // We also place a tight stop loss since we trying to short an uptrend
        strategy.exit("Pullback Exit", "Pullback", limit=shorttarget, loss=400)