Golden Cross Optimized Moving Average Crossover Trading Strategy

Overview
This strategy optimizes the conventional moving average crossover strategy by setting three moving averages with different periods, constructing a golden cross pattern with 9-period, 50-period and 100-period moving averages. It generates buy signals when the short-term MA crosses above the medium-term MA while the long-term MA is in an uptrend. The strategy name is "Optimized Golden Cross Moving Average Crossover Trading Strategy".
Strategy Logic
The strategy utilizes three moving averages with periods of 9, 50 and 100. The 9-period MA is the short-term MA, 50-period MA is the medium-term MA, and 100-period MA is the long-term MA. Trading signals are generated by the crossover between the short-term MA and medium-term MA. Specifically, when the long-term MA is in an uptrend (above the medium-term MA), a buy signal is triggered when the short-term MA crosses above the medium-term MA. A sell signal is triggered when the short-term MA crosses below the medium-term MA.
Advantage Analysis
Compared with the conventional dual moving average crossover strategy, this strategy adds the condition of judging medium and long-term trends before generating trading signals, which can effectively filter out some invalid signals. When long-term trends are unclear, the strategy will not generate signals, avoiding being trapped in consolidation. At the same time, this strategy is suitable for capturing trending moves in the short and medium term, reducing the possibility of aggressive entry.
Risk Analysis
When setting parameters for this strategy, the combination of moving average periods needs to be adjusted. Different period combinations will have an impact on the strategy's effectiveness. If the period parameters are not set properly, there is a risk of generating too many false signals. In addition, traders need to be aware of potential systemic risks and timely stop losses to mitigate risks.
Optimization Directions
Consider incorporating other indicators to aid in judging market trends, such as MACD, BOLL, etc., and set stricter entry conditions, or incorporate volatility indicators to construct adaptive moving averages so that parameters can automatically adjust based on market conditions to further optimize the strategy.
Conclusion
Based on the conventional dual moving average crossover, this strategy adds long-term MA judgment and filter conditions, which can effectively filter out false signals and is suitable for capturing short to medium-term trending moves. It is a simple and practical trend-following strategy. However, traders still need to pay attention to parameter optimization and systemic risks, and formulate scientific risk management strategies.
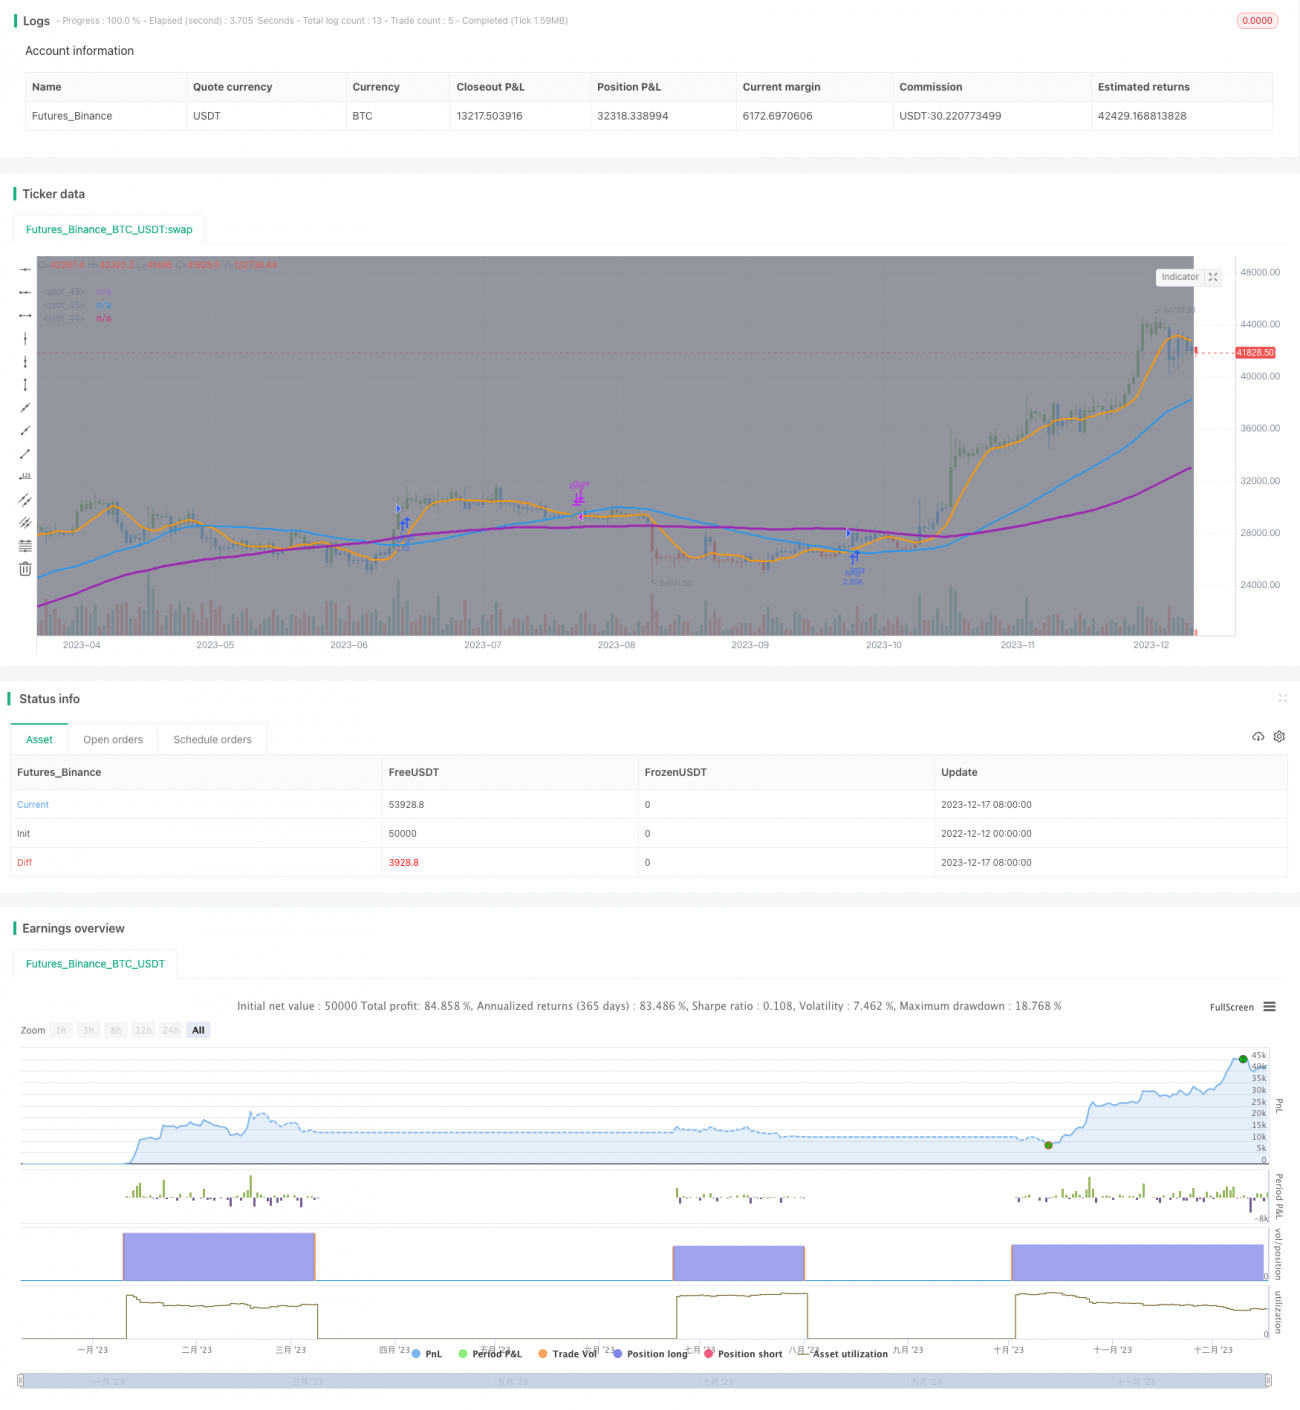
/*backtest
start: 2022-12-12 00:00:00
end: 2023-12-18 00:00:00
period: 1d
basePeriod: 1h
exchanges: [{"eid":"Futures_Binance","currency":"BTC_USDT"}]
*/

//@version=4
strategy("Golden Cross, SMA 100, Moving Average Strategy (by Coinrule)", shorttitle="Golden_Cross_Strat_MA100_optimized", overlay=true, initial_capital = 1000,process_orders_on_close=true, default_qty_type = strategy.percent_of_equity, default_qty_value = 100)

// Input- 1