Fractal Breakout Strategy

Overview
This is a trend-following long line tracking strategy that judges the trend based on price fractals. It decides to open positions based on the breakthrough of the latest fractal point. At the same time, it judges the trend direction by calculating the average price of the last N fractal points and closes positions when the trend changes.
Principles
-
Calculate the fractal points of prices. The fractal point is defined as the highest price today that is higher than the highest prices of the previous two days and the next two days.
-
Record the price of the last fractal point as resistance.
-
When the closing price breaks through the last fractal point, it is considered that the resistance has been broken and a long position has been established.
-
Calculate the average price of the last N fractal points to determine the trend. When the average price rises, it is a bullish trend, and when it falls, it is a bearish trend.
-
If the average fractal point price turns down during the long position, close the position.
Advantage Analysis
The biggest advantage of this fractal-based trend judgment strategy is that it can effectively filter market noise and determine longer-term trend directions. Compared with simple moving average lines and other indicators, it has greater resistance to sudden abnormal fluctuations.
In addition, the criteria for opening and closing positions of this strategy are very clear, which avoids frequent trading. It also makes it particularly suitable for long-term holdings.
Risk Analysis
The biggest risk of this strategy lies in the probabilistic nature of the fractal points themselves. Fractals cannot fully predict whether prices will definitely reverse, that is, the probability of misjudgment still exists. When misjudgments occur, it will face the risk of losses.
In addition, the time span for judging fractal points is long and cannot adapt to high frequency trading. If you pursue short-term trading, this strategy may not be suitable.
Optimization Directions
Considering the probability of misjudgment of fractal points, we can optimize in the following ways:
-
Combine with other indicators such as Bollinger Bands, moving averages, etc. to avoid misjudgments based solely on fractal points.
-
Adjust the parameters of fractal points, such as the number of periods before and after judgment, to optimize fractal point judgments.
-
Add stop loss strategies to stop losses when losses expand to a certain extent.
Summary
The Fractal Breakout Strategy is very suitable for judging long-term trends overall and is very suitable for use by long-term investors. As long as we properly adjust the parameters appropriately, add other filtering indicators on the premise of ensuring the accuracy of judgment, we can greatly optimize this strategy and make it an important part of quantitative Decision.
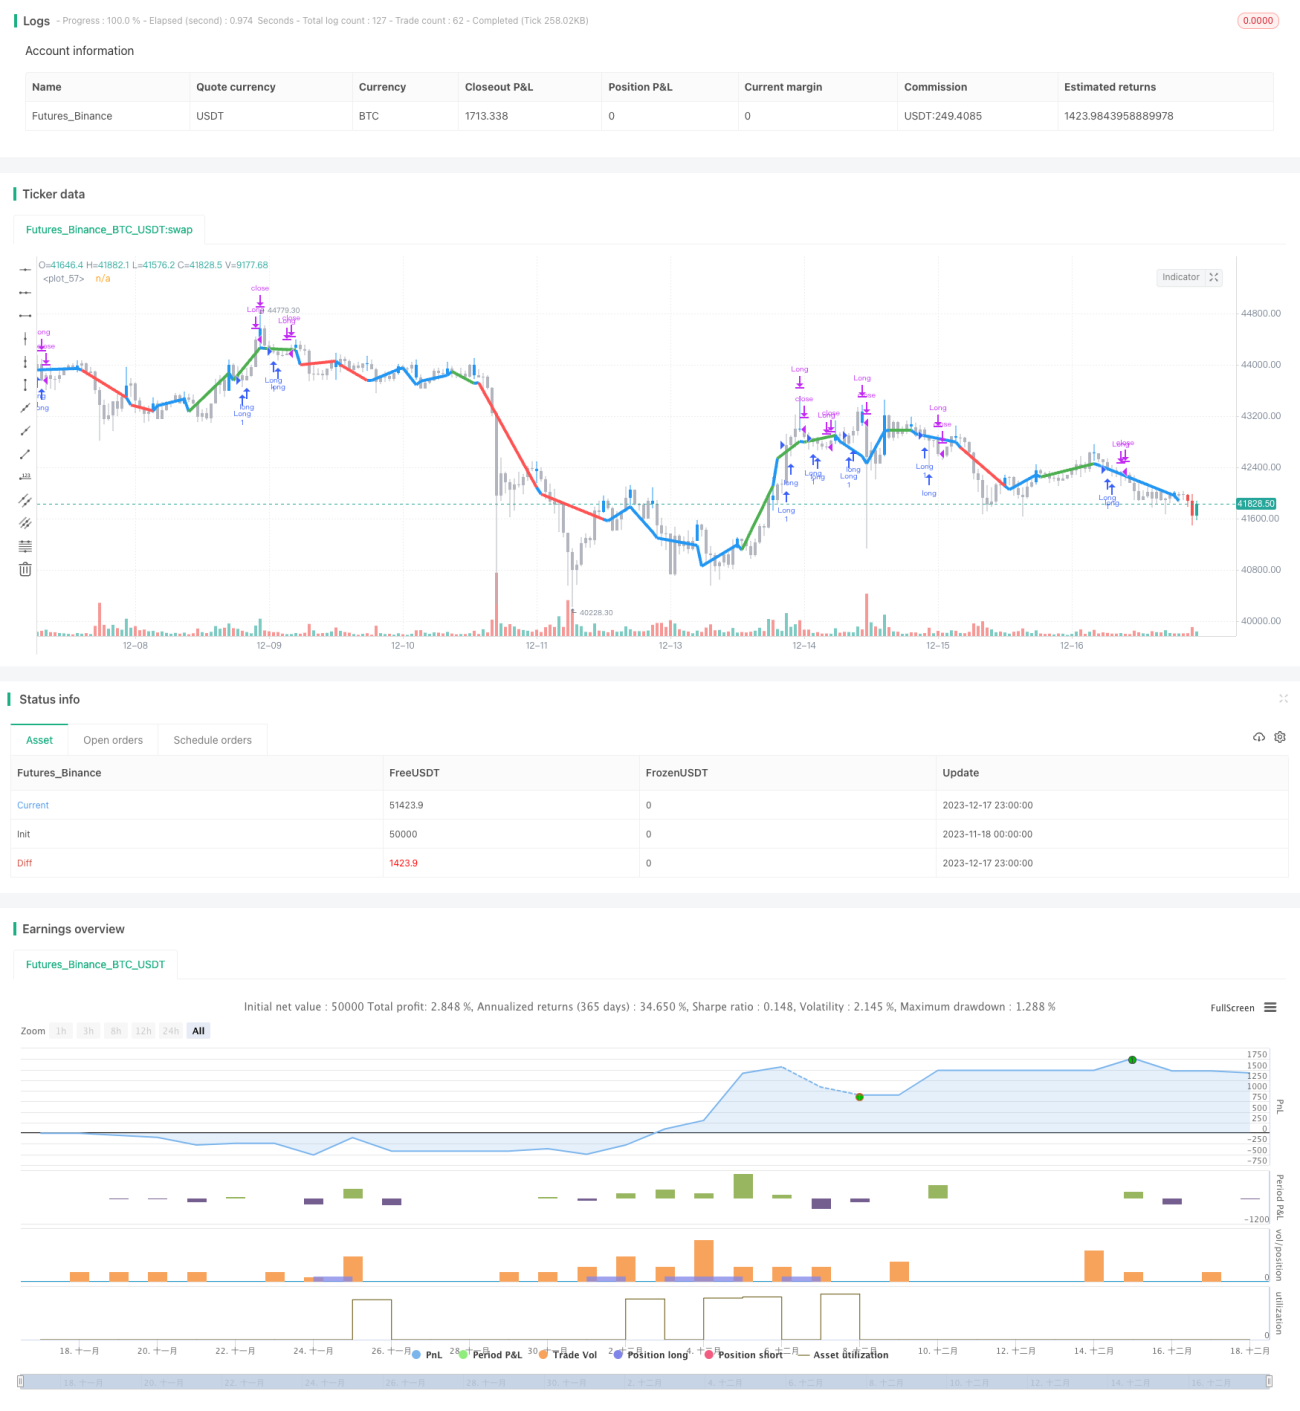
/*backtest
start: 2023-11-18 00:00:00
end: 2023-12-18 00:00:00
period: 1h
basePeriod: 15m
exchanges: [{"eid":"Futures_Binance","currency":"BTC_USDT"}]
*/

//@version=2
strategy("Fractal Breakout Strategy (by ChartArt)", shorttitle="CA_-_Fractal_Breakout_Strat", overlay=true)

// ChartArt's Fractal Breakout Strategy- 1