Ichimoku Moving Average Crossover Strategy

Author: ChaoZhang, Date: 2023-12-19 15:40:53
Tags:

img

Overview

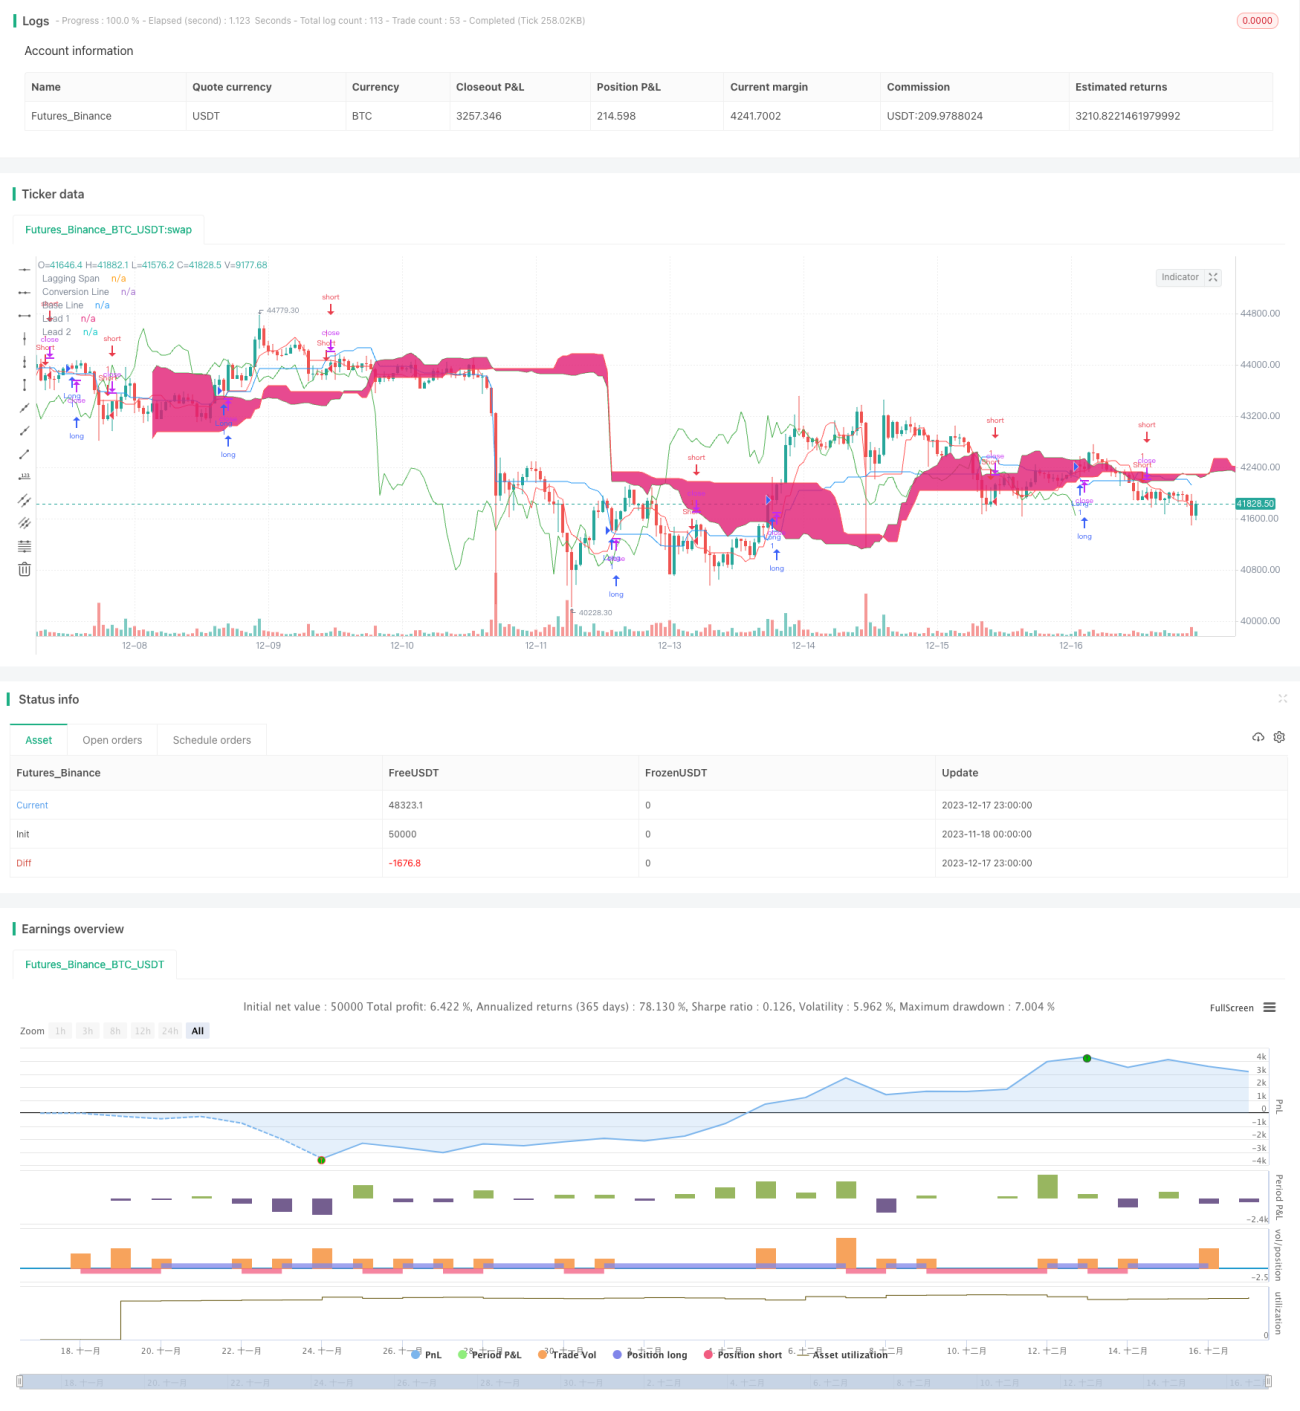
The Ichimoku moving average crossover strategy identifies long and short signals by calculating a set of moving averages and detecting price crosses. This strategy combines multiple technical indicators and provides solid and reliable trading for middle-to-long term operations.

Strategy Logic

The Ichimoku strategy utilizes a specialized system consisting of 5 moving average lines, namely the conversion line, base line, leading span 1, leading span 2, and lagging span. Specifically, the conversion line depicts recent price momentum, the base line shows the medium-to-long term trend, the leading lines combine the conversion and base to predict future moves, and the lagging span displays past prices for reference. Trading signals are generated when the price breaks through the base line. The strategy also incorporates body filters and candlestick colors to avoid false breaks.

Advantages

The Ichimoku strategy amalgamates the strengths of various technical indicators into one system. It fuses concepts of moving averages, price channels, volume confirmation etc., forming a systematic methodology. This ensures accuracy and directionality of the trading signals. Compared to single-indicator strategies, it greatly reduces false signals and increases profit factors.

Risks

As a trend following system, the Ichimoku strategy has relatively long trading intervals. This means short-term price oscillations cannot be captured. Also, moving averages fail when prices fluctuate violently. Such situations can lead to wrong signals and losing trades. It is advisable to use stops to control risks.

Enhancement Opportunities

The Ichimoku strategy can be improved in areas like: 1) Adjusting average parameters for different periods and products; 2) Incorporating volume indicators to confirm price-volume relations; 3) Introducing machine learning models to refine signal determination; 4) Adding more filters to lower incorrect trade probability.

Conclusion

The stable and reliable Ichimoku moving average crossover strategy is suitable as a core strategy combined with other algorithms. Its clear trend guidance and flexibility owing to parameter tuning and multi-indicator optimization make it worthwhile for in-depth research and long-term application by quant traders.


/*backtest
start: 2023-11-18 00:00:00
end: 2023-12-18 00:00:00
period: 1h
basePeriod: 15m
exchanges: [{"eid":"Futures_Binance","currency":"BTC_USDT"}]
*/

//Noro
//2018

//@version=3
strategy(title = "Noro's Ichimoku Strategy v1.0", shorttitle = "Ichimoku str 1.0", overlay = true, default_qty_type = strategy.percent_of_equity, default_qty_value = 100, pyramiding = 0)

//Settings
needlong = input(true, defval = true, title = "Long")
needshort = input(true, defval = true, title = "Short")
conversionPeriods = input(9, minval = 1, title = "Conversion Periods")
basePeriods = input(26, minval = 1, title = "Base Periods")
laggingSpan2Periods = input(52, minval = 1, title = "Lagging Span")
usebf = input(true, defval = true, title = "Use body filter")
usecf = input(true, defval = true, title = "Use color filter")
fromyear = input(1900, defval = 1900, minval = 1900, maxval = 2100, title = "From Year")
toyear = input(2100, defval = 2100, minval = 1900, maxval = 2100, title = "To Year")
frommonth = input(01, defval = 01, minval = 01, maxval = 12, title = "From Month")
tomonth = input(12, defval = 12, minval = 01, maxval = 12, title = "To Month")
fromday = input(01, defval = 01, minval = 01, maxval = 31, title = "From day")
today = input(31, defval = 31, minval = 01, maxval = 31, title = "To day")

//Ichimoku
donchian(len) => avg(lowest(len), highest(len))
conversionLine = donchian(conversionPeriods)
baseLine = donchian(basePeriods)
leadLine1 = avg(conversionLine, baseLine)
leadLine2 = donchian(laggingSpan2Periods)

//Lines
plot(conversionLine, color=red, title="Conversion Line")
plot(baseLine, color=blue, title="Base Line")
plot(close, offset = -basePeriods, color=green, title="Lagging Span")
p1 = plot(leadLine1, offset = basePeriods, color=green, title="Lead 1")
p2 = plot(leadLine2, offset = basePeriods, color=red, title="Lead 2")
fill(p1, p2)

//Body Filter
nbody = abs(close - open)
abody = sma(nbody, 10)
body = nbody > abody / 3 or usebf == false

//Color Filter
bar = close > open ? 1 : close < open ? -1 : 0
gb = bar == 1 or usecf == false
rb = bar == -1 or usecf == false

//Signals
up = low > baseLine and rb and body
dn = high < baseLine and gb and body

//Trading
if up
    //if strategy.position_size < 0
    //    strategy.close_all()
        
    strategy.entry("Long", strategy.long, needlong == false ? 0 : na, when=(time > timestamp(fromyear, frommonth, fromday, 00, 00) and time < timestamp(toyear, tomonth, today, 23, 59)))

if dn
    //if strategy.position_size > 0
    //    strategy.close_all()
        
    strategy.entry("Short", strategy.short, needshort == false ? 0 : na, when=(time > timestamp(fromyear, frommonth, fromday, 00, 00) and time < timestamp(toyear, tomonth, today, 23, 59)))
    
if time > timestamp(toyear, tomonth, today, 23, 59)
    strategy.close_all()

More