Pivot Point Forecast Oscillator Backtesting Strategy

Overview
This strategy backtests the Pivot Point Forecast Oscillator developed by Tushar Chande. The oscillator calculates the percentage difference between the closing price and the n-period linear regression forecasted price. It crosses above 0 when the forecast price is greater than the closing price and crosses below 0 when less than. This can be used to identify turning points in the market.
Strategy Logic
The strategy utilizes the Pivot Point Forecast Oscillator to determine market direction. Specifically, it calculates the percentage difference between the n-period linear regression forecasted price and the actual closing price. When the percentage difference crosses above 0, it goes long. When the percentage difference crosses below 0, it goes short. The complete trading logic is as follows:
- Calculate n-period linear regression forecast price xLG
- Calculate percentage difference between closing price and forecast price xCFO
- Determine relationship between xCFO and 0 to output signal possig
- xCFO > 0 and long is allowed, possig = 1
- xCFO < 0 and short is allowed, possig = -1
- Otherwise, possig = 0
- Go long or short based on possig signal
The strategy is simple and straight-forward, comparing actual price with forecast price to determine if the market is overestimated or underestimated, thus generating trading signals.
Advantage Analysis
The strategy has the following advantages:
- Clear logic, easy to understand and implement.
- Few parameters, easy to tune.
- Flexible in choosing timeframes, adaptable to different markets.
- Convenient to switch between long and short.
- Visual indicator forms clear trading signals.
Risk Analysis
The strategy also has some risks:
- Linear regression prediction has timeliness, may not sustain effectiveness.
- Improper parameter selection may cause over-trading.
- Black swan events may cause incorrect signals.
Counter measures:
- Combine with other indicators to ensure validity of linear regression prediction.
- Optimize parameters to lower trading frequency.
- Add stop loss to control single trade loss.
Optimization Directions
The strategy can be improved in the following aspects:
- Combine with MA and other indicators to enrich trading signals.
- Add stop loss to avoid huge losses.
- Optimize parameters to find best combination.
- Add automatic take profit.
- Consider trading costs, set reasonable stop loss and take profit.
Conclusion
The Pivot Point Forecast Oscillator is a quant trading strategy utilizing linear regression forecast prices. The strategy has simple logic and flexible parameters, generating clear trading signals. There is room for further improvement in optimizing stop loss, parameter selection, combining other indicator signals etc, to achieve better trading performance.
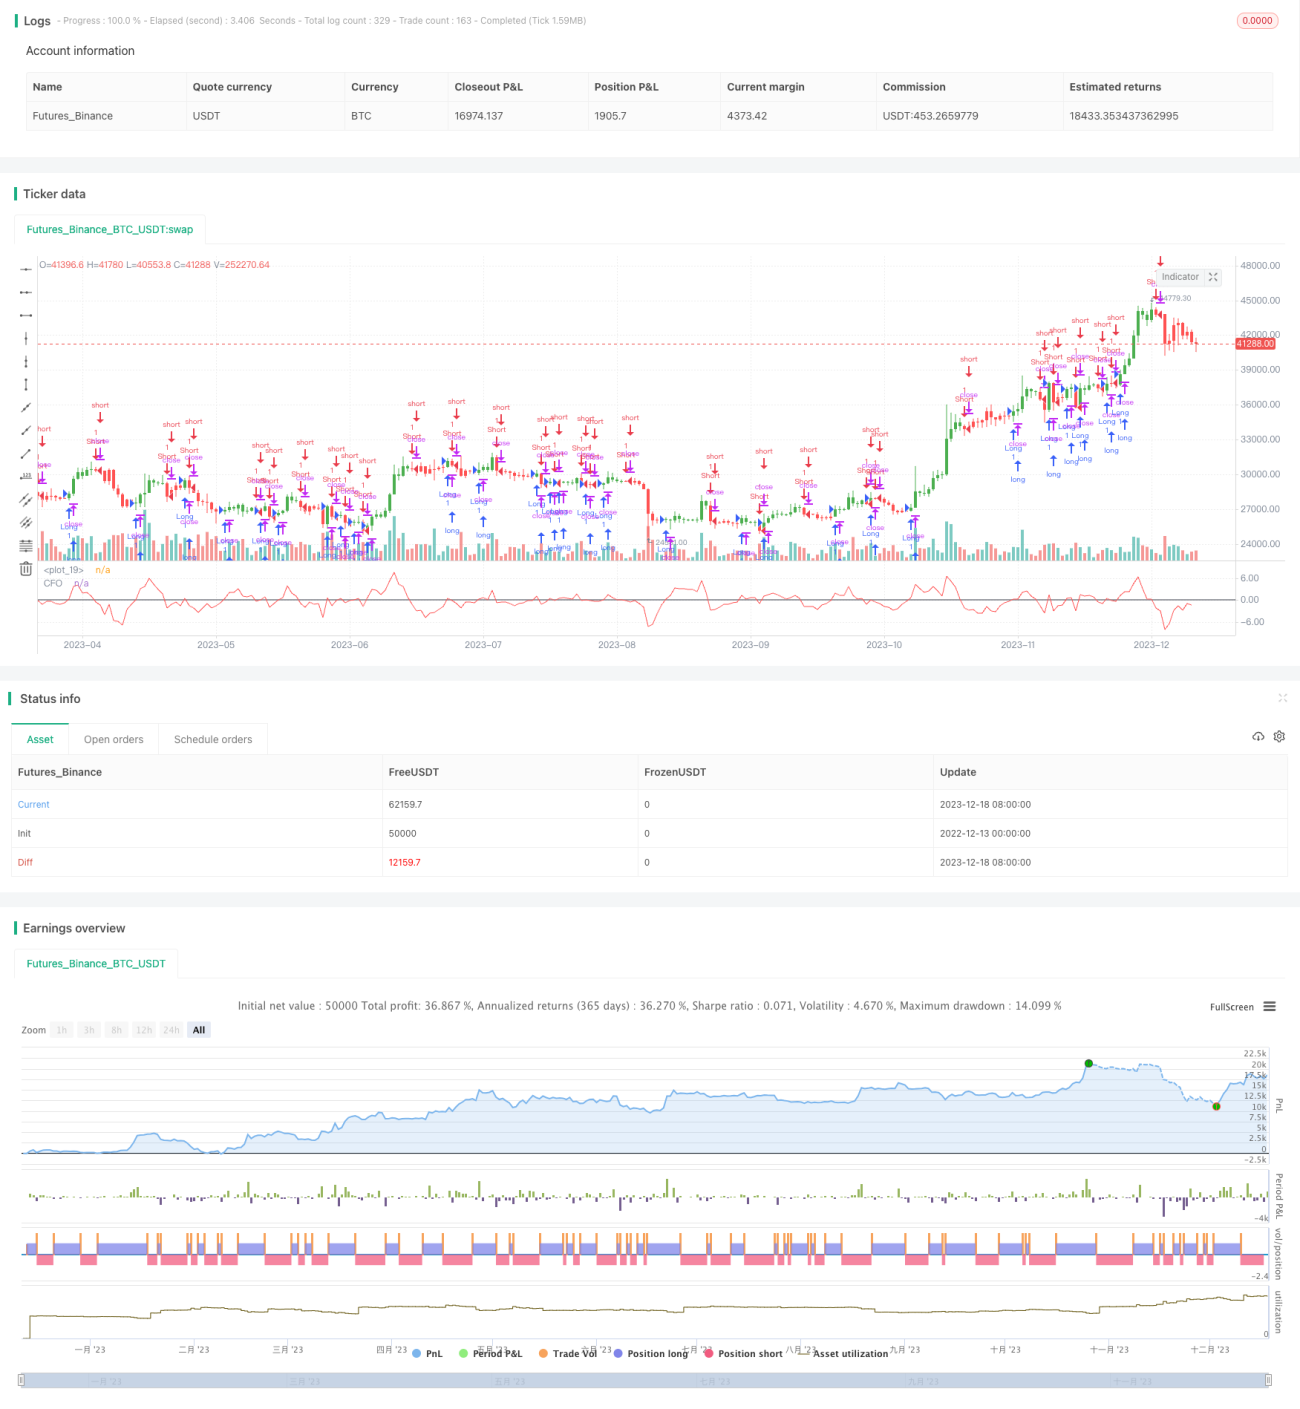
/*backtest
start: 2022-12-13 00:00:00
end: 2023-12-19 00:00:00
period: 1d
basePeriod: 1h
exchanges: [{"eid":"Futures_Binance","currency":"BTC_USDT"}]
*/

//@version=2
////////////////////////////////////////////////////////////
//  Copyright by HPotter v1.0 19/03/2018
// The Chande Forecast Oscillator developed by Tushar Chande The Forecast - 1